Why Monte Carlo Forecasting Beats a Single Delivery Date
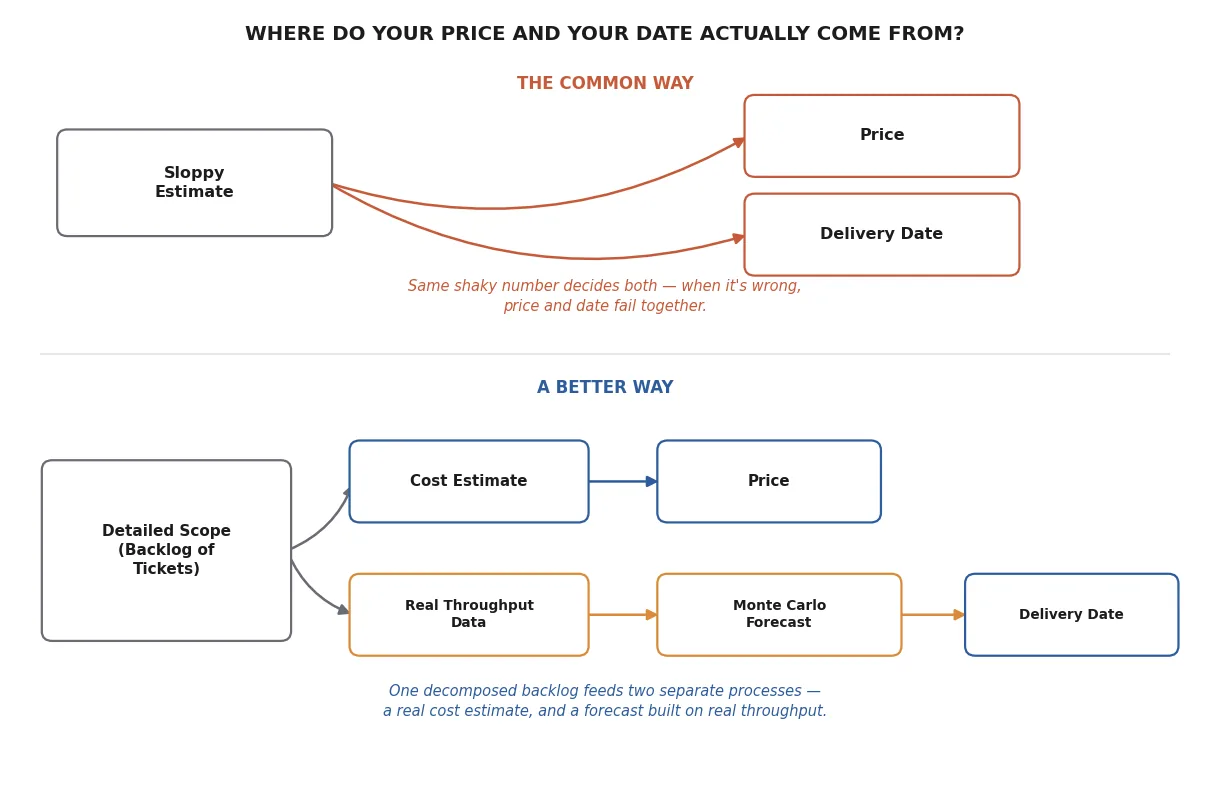
Every agency has given a client a date like this at least once: "We'll have it done by the 15th." It sounds confident. It's usually a guess — a PM looked at the backlog, added a bit of buffer for the unknown, and picked a number that felt safe enough to say out loud. The problem isn't that the guess is careless. It's that a single date can't represent something that is, by nature, uncertain.
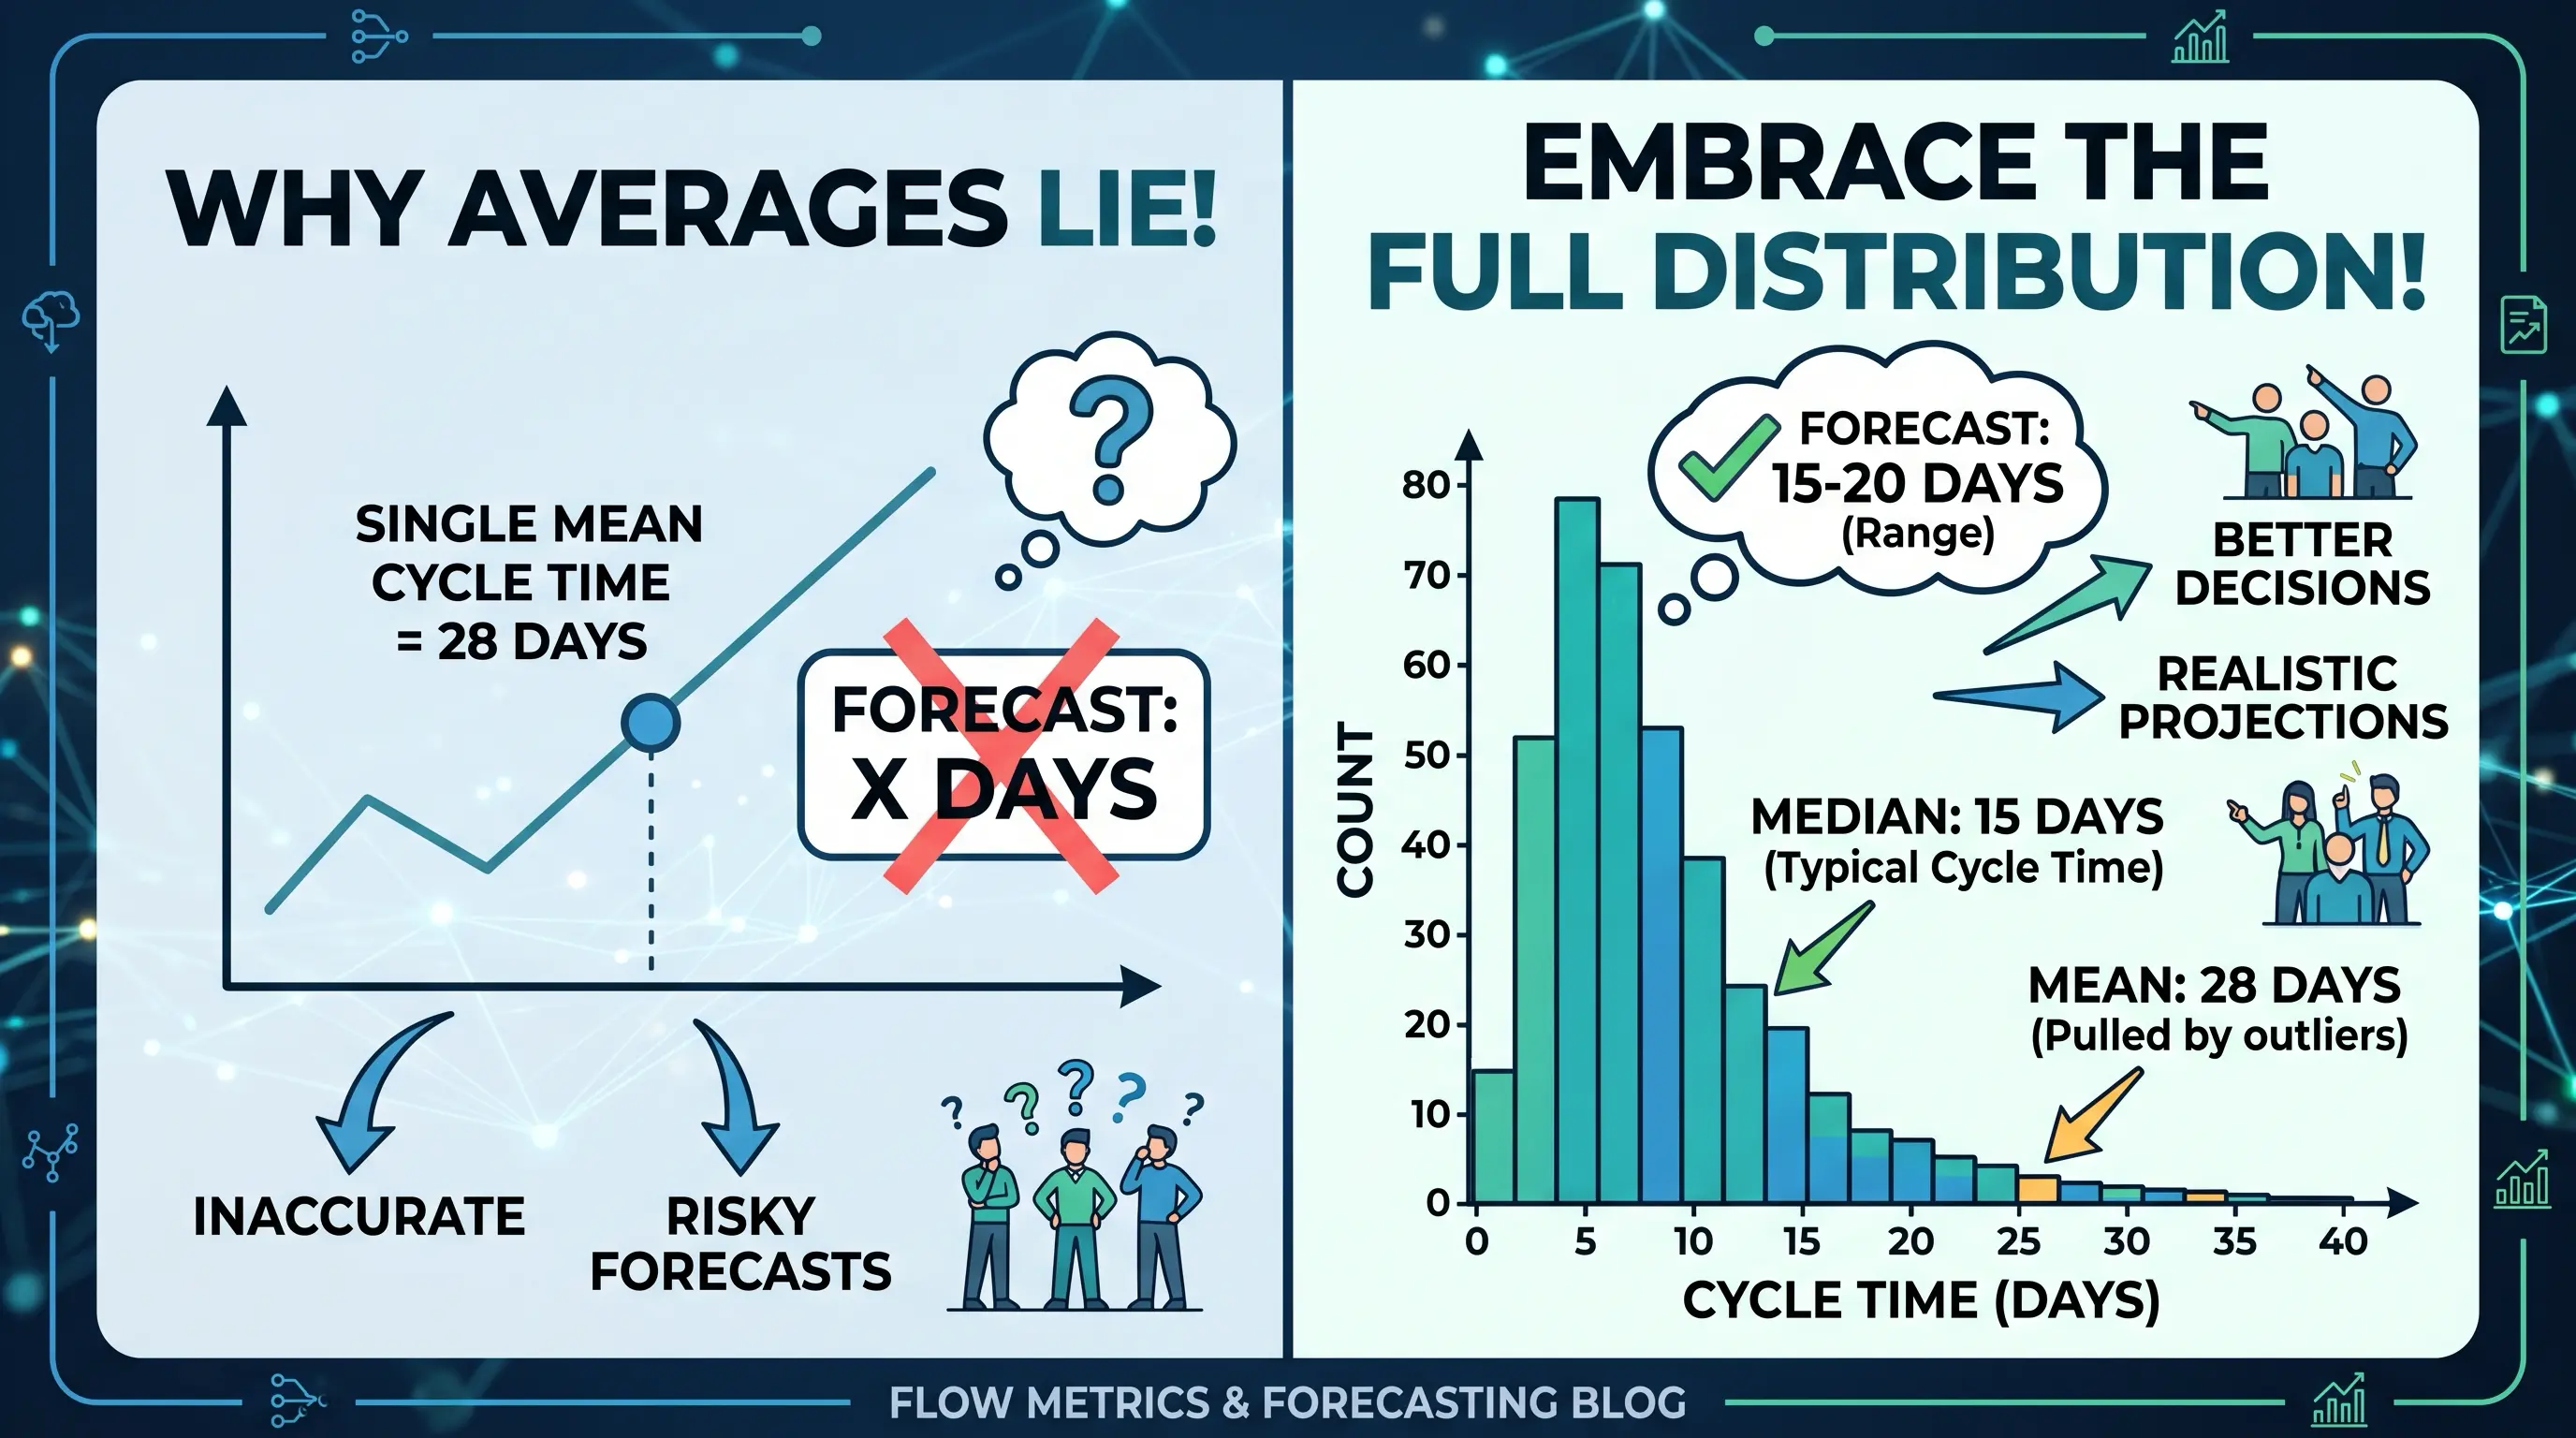
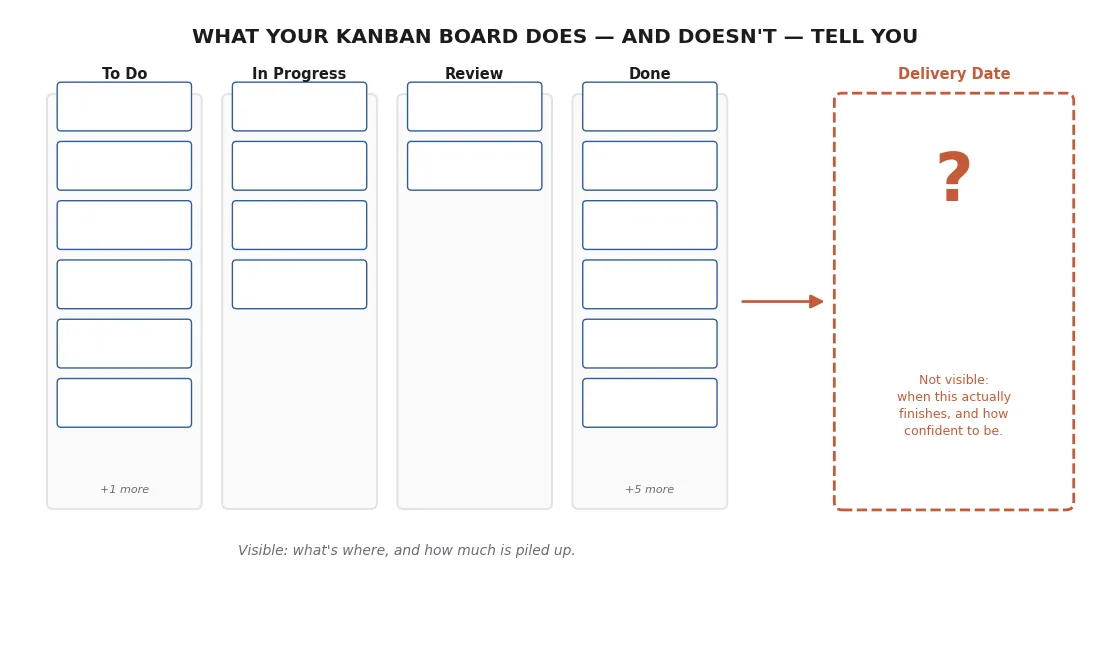
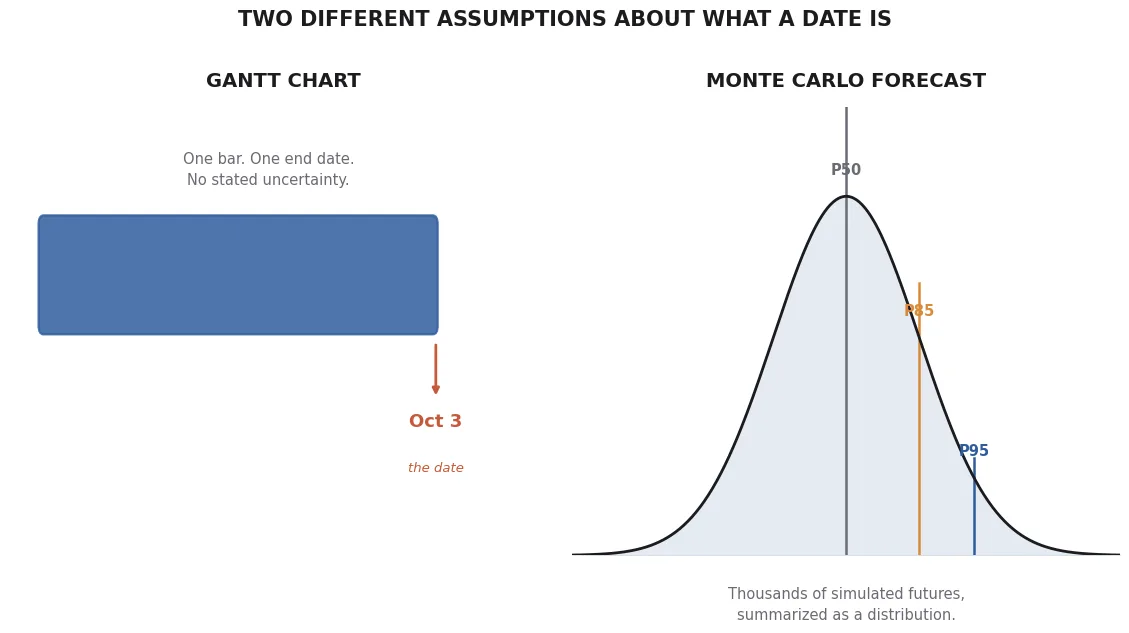
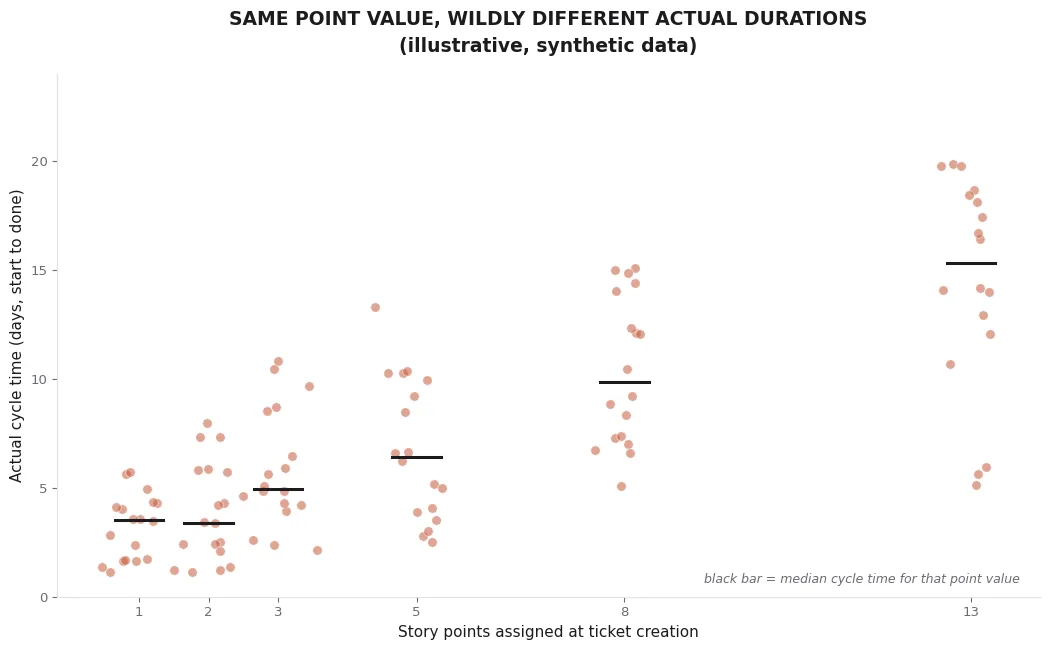
Software and creative work don't take a fixed amount of time. Two tickets that look identical on a board can take two days or two weeks, depending on what they turn up once someone starts. A Gantt chart hides this by assigning each task one duration and adding them up, which produces a date that looks precise and is almost never right. The precision is fake; the uncertainty didn't go away, it just stopped being visible.
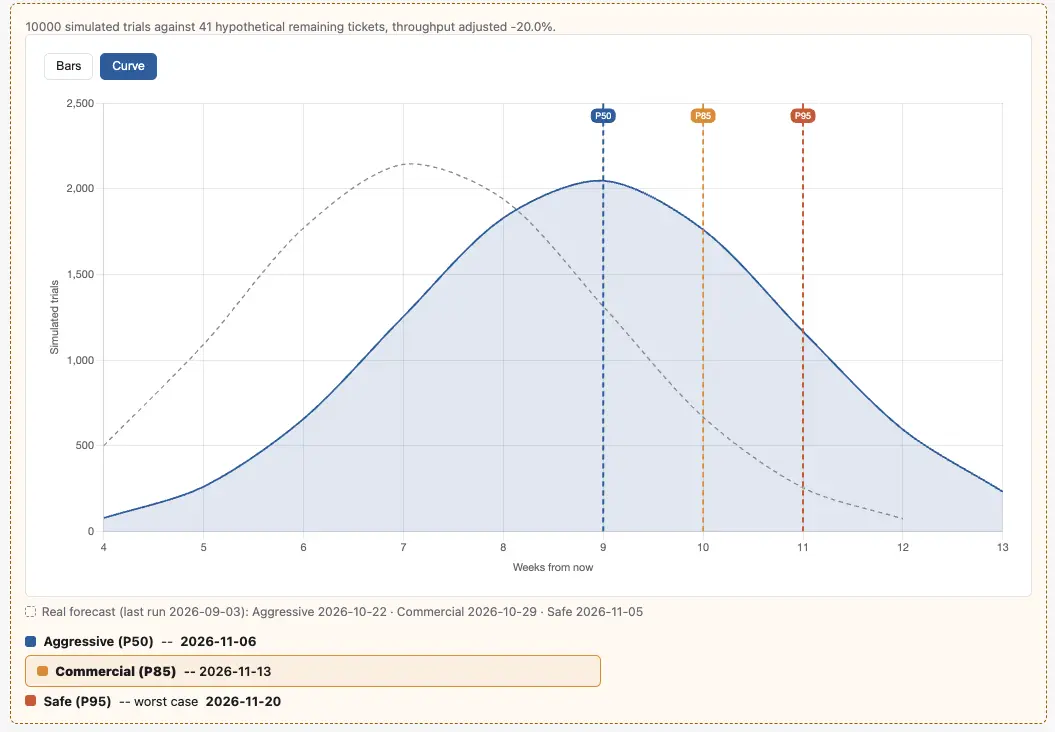
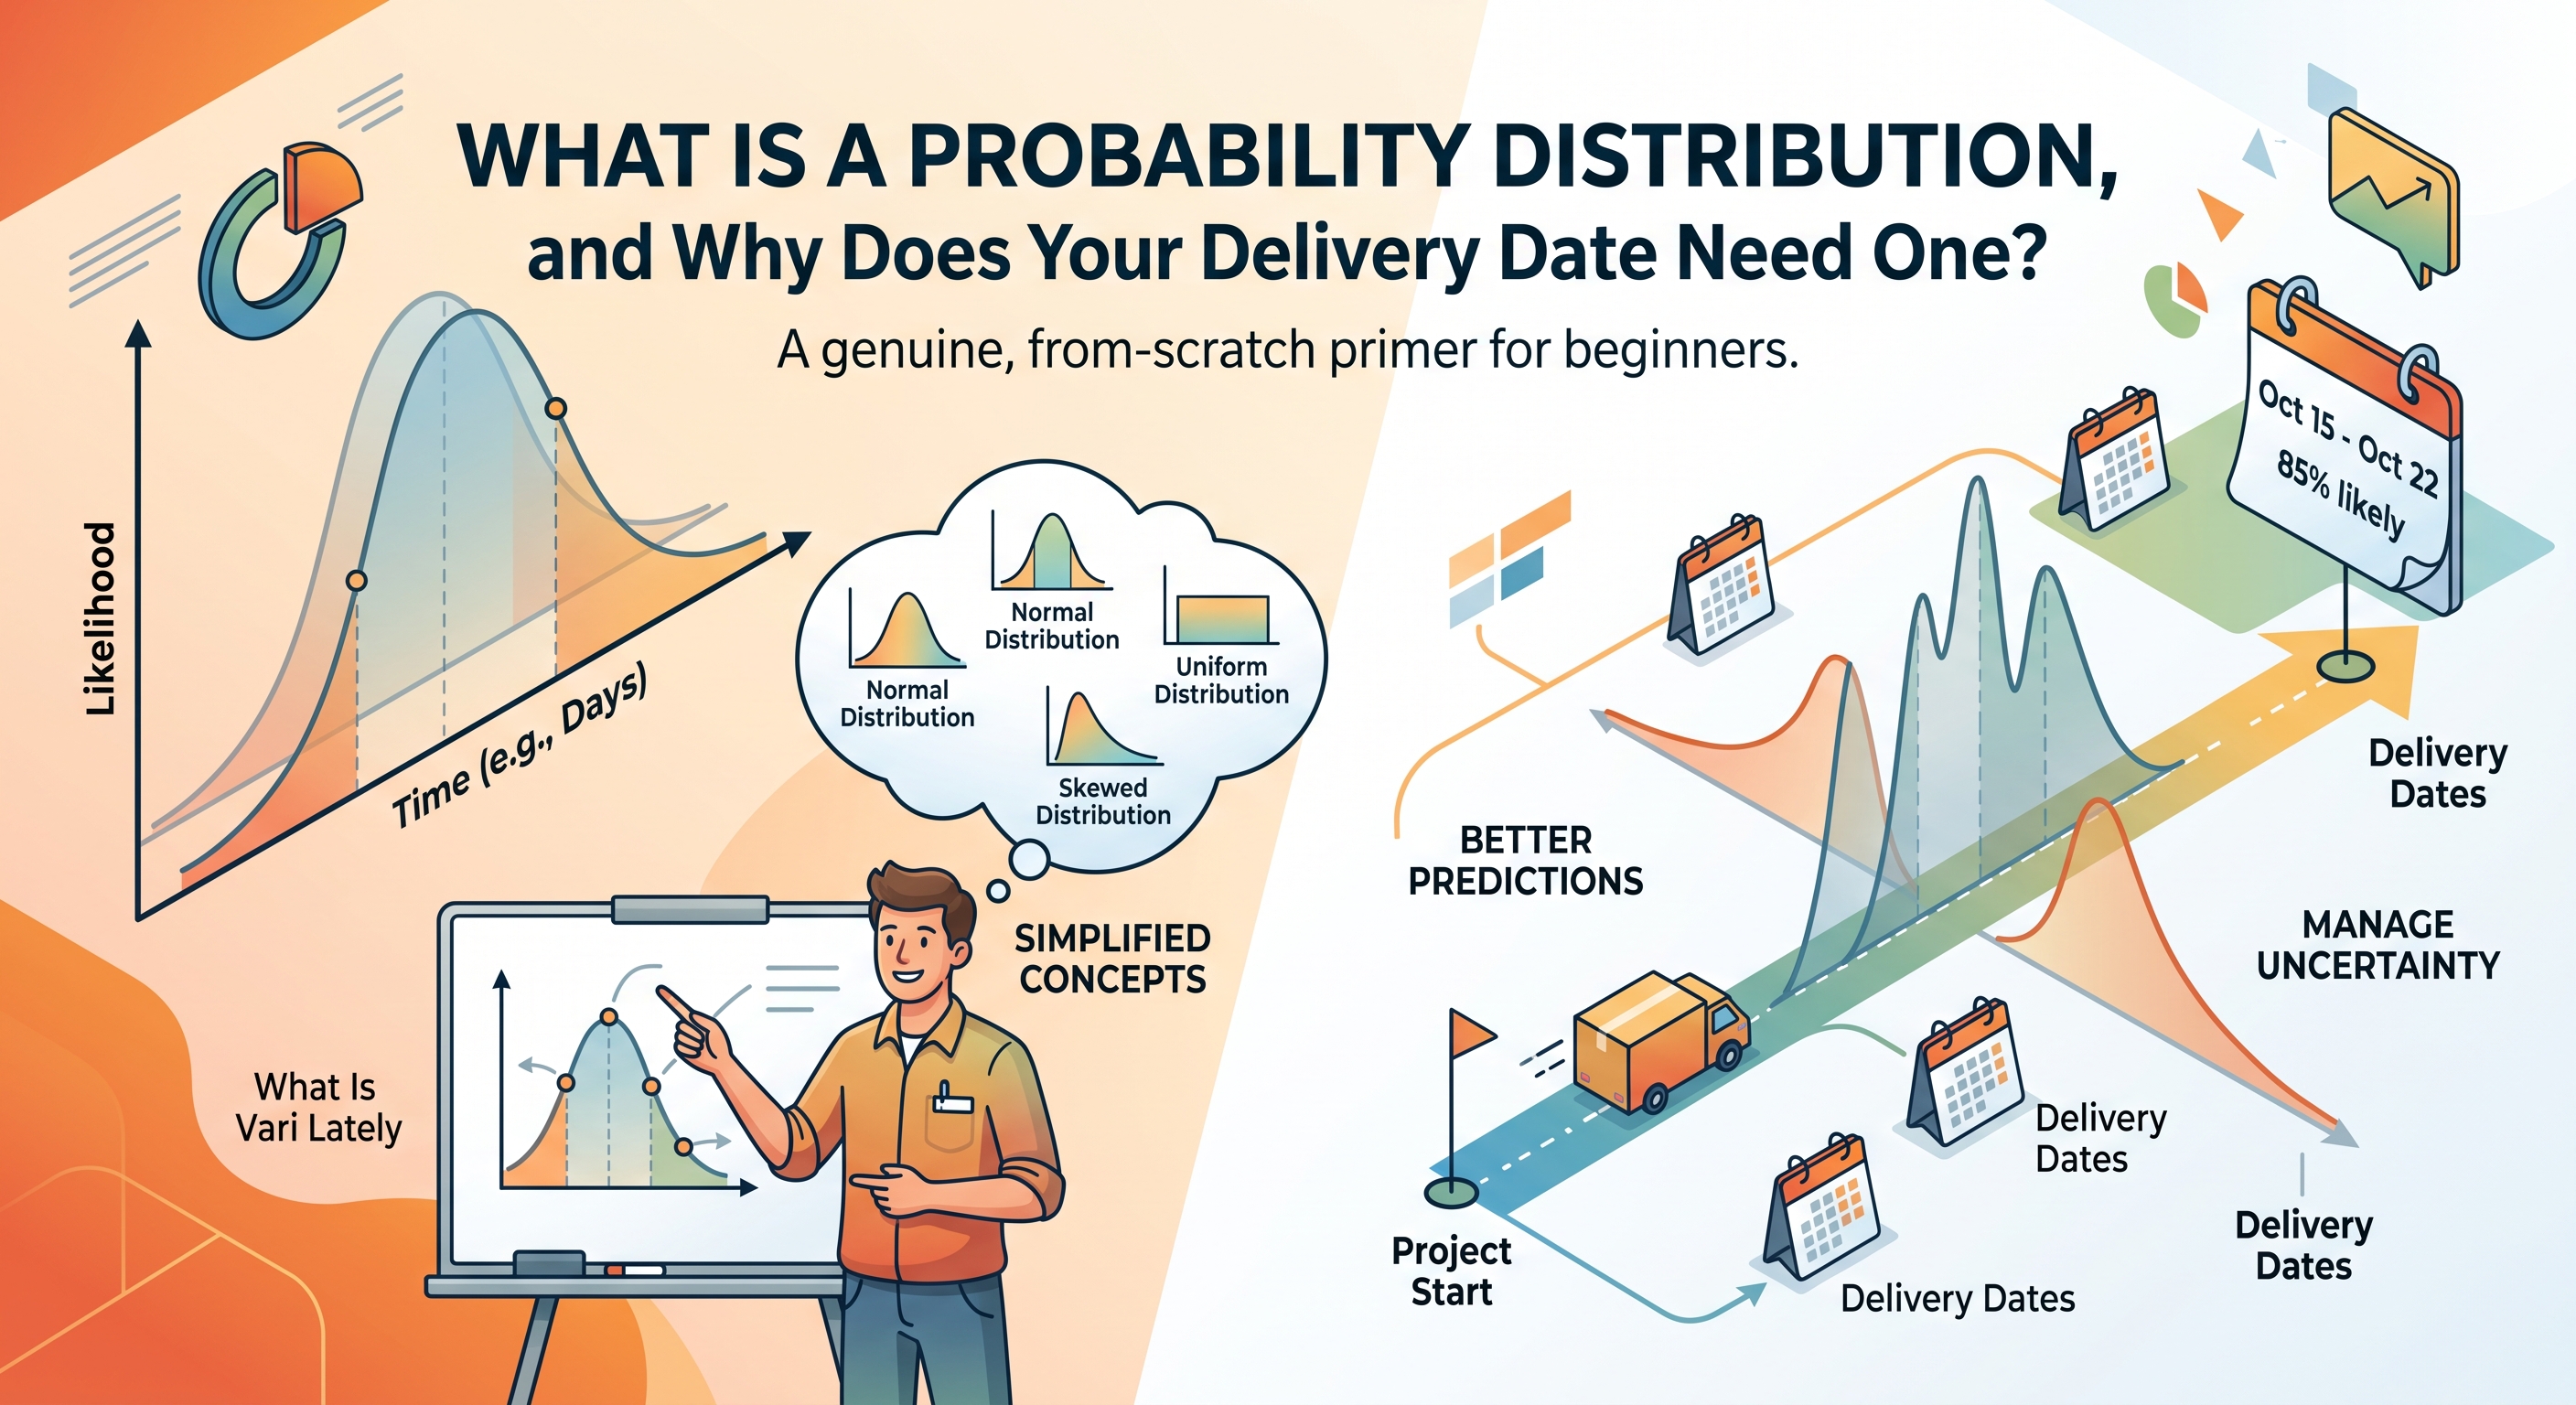
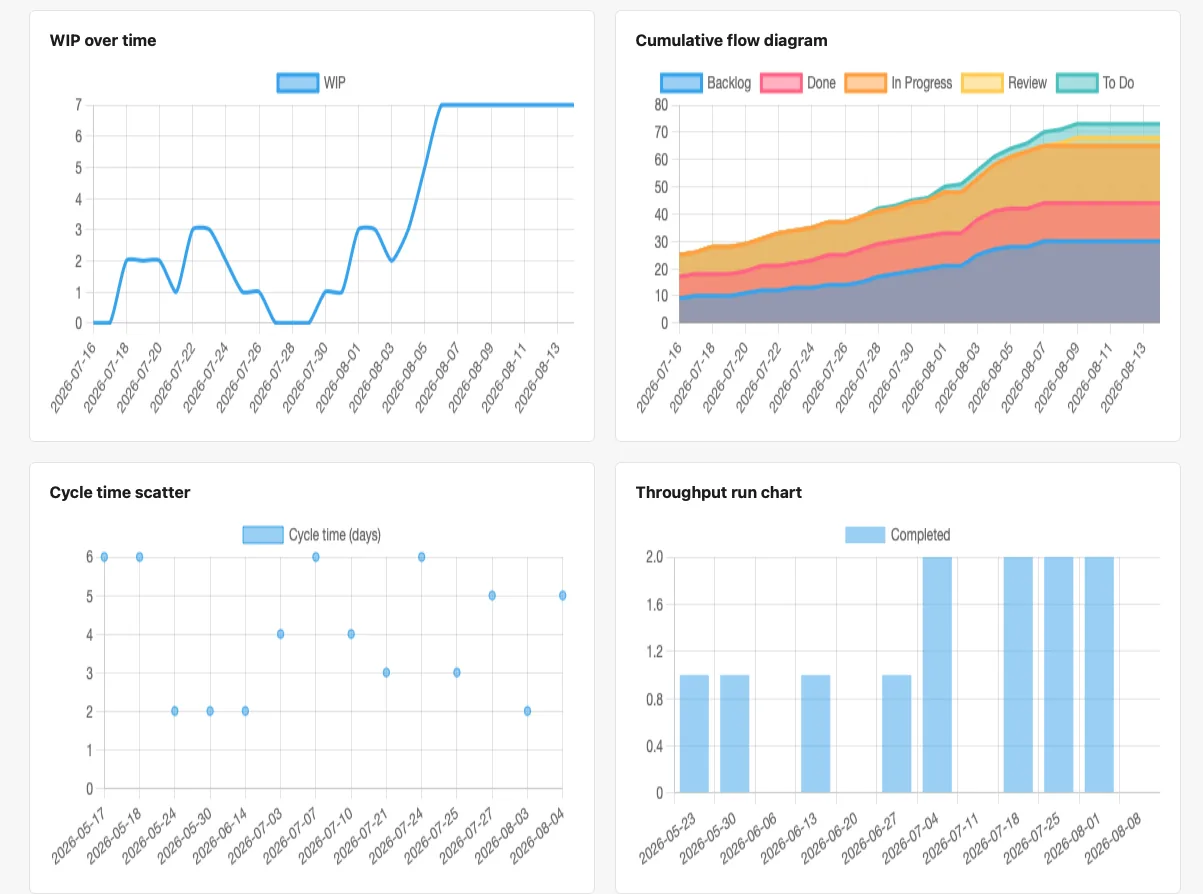
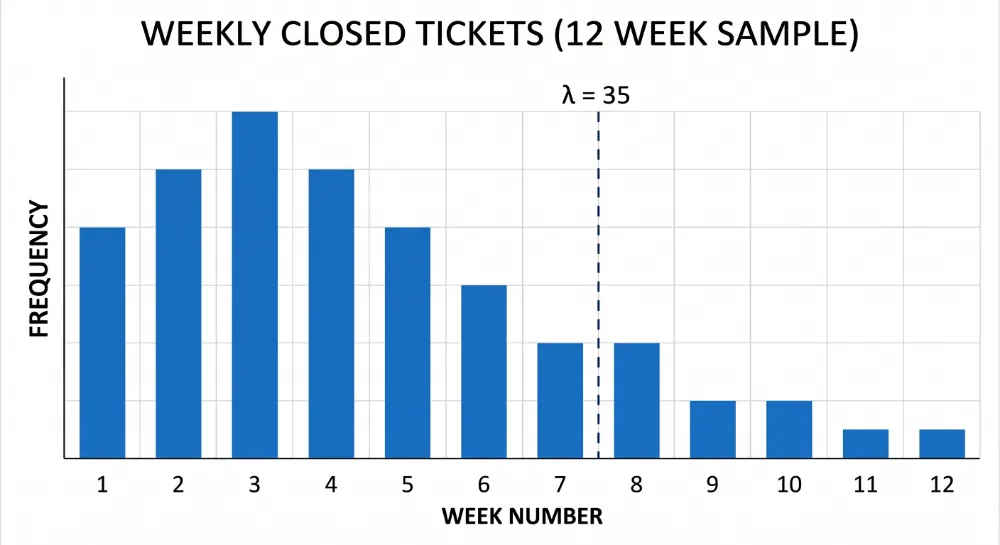
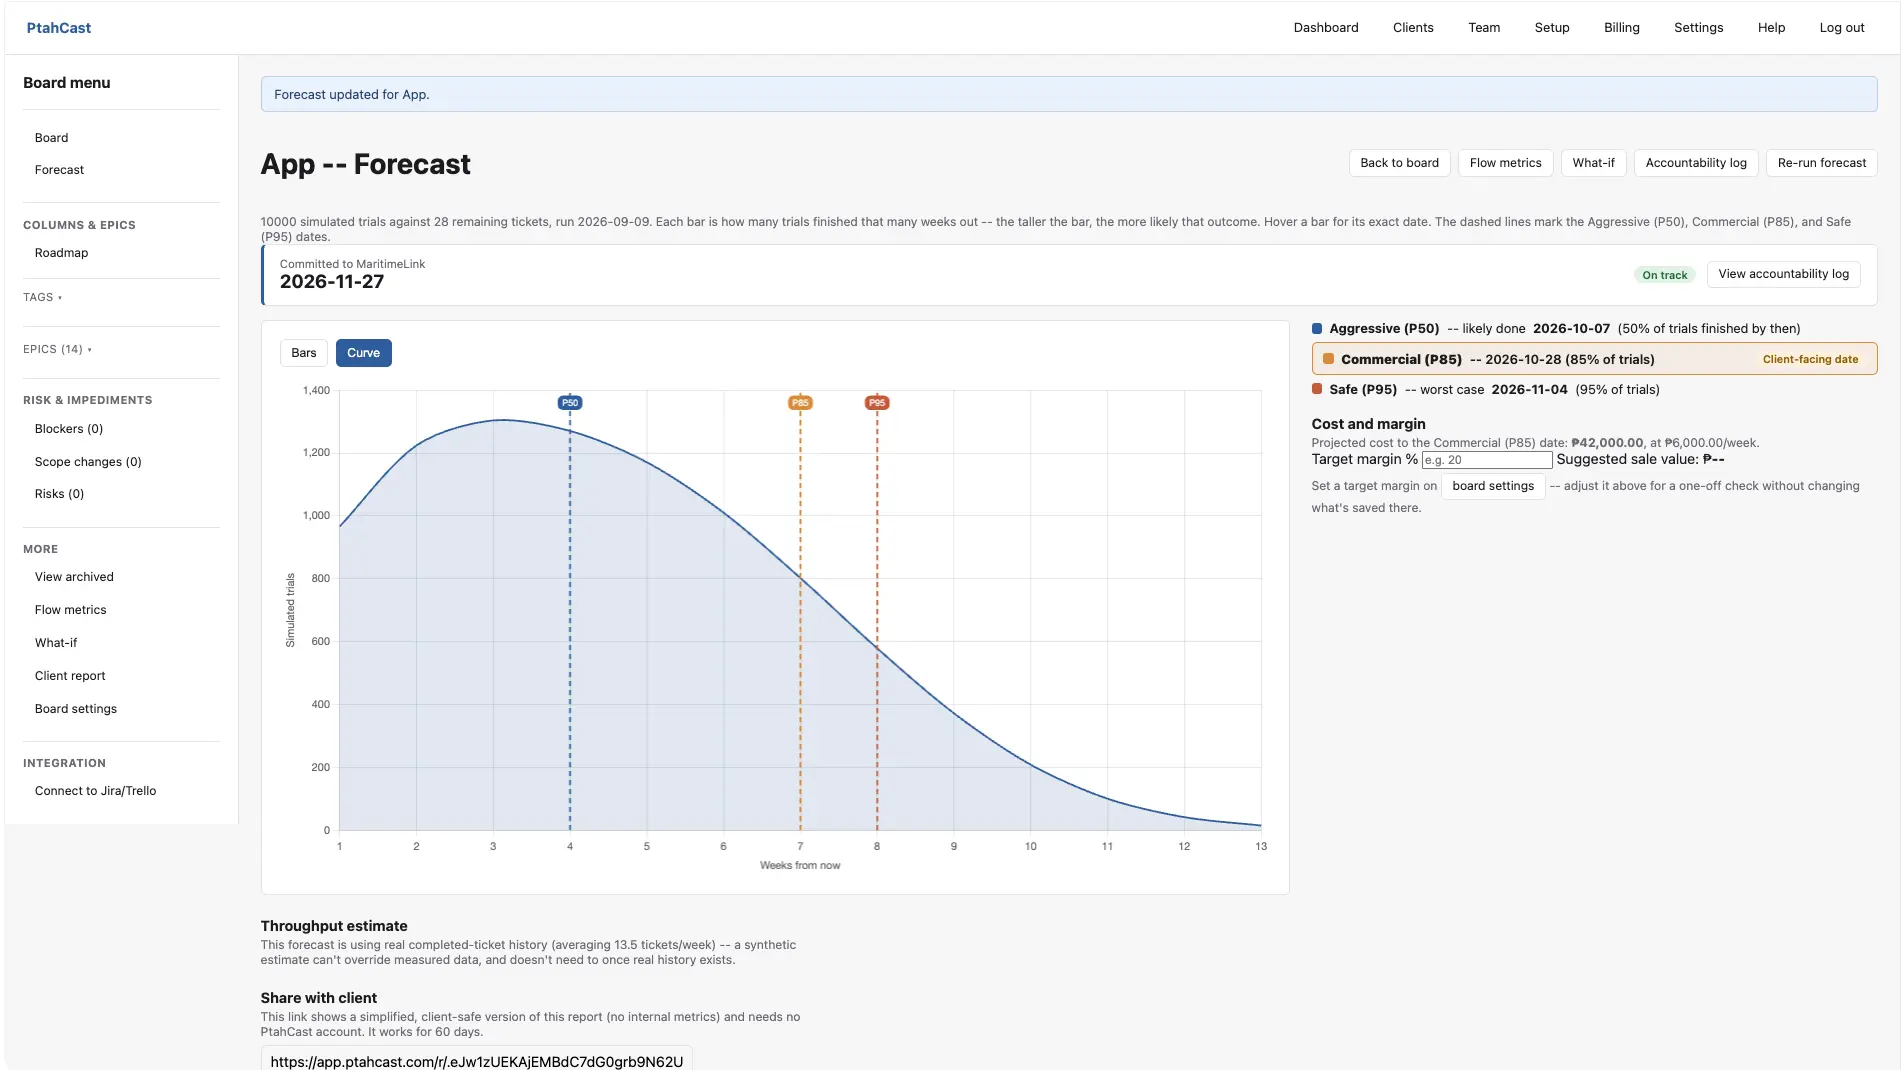
Monte Carlo forecasting starts from the opposite assumption: work is variable, so a forecast should describe a range of outcomes, not a point. The method itself is simple. Take a team's actual history — how long tickets have really taken to move from start to done, and how many the team actually finishes in a given week. Then simulate the remaining backlog thousands of times, each time randomly resampling from that real history instead of from a plan. Some simulated runs get lucky and finish fast. Some hit a string of slow tickets. Run it 10,000 times and you don't get one date — you get a distribution of dates, weighted by how often each one actually occurred across all those simulated futures.
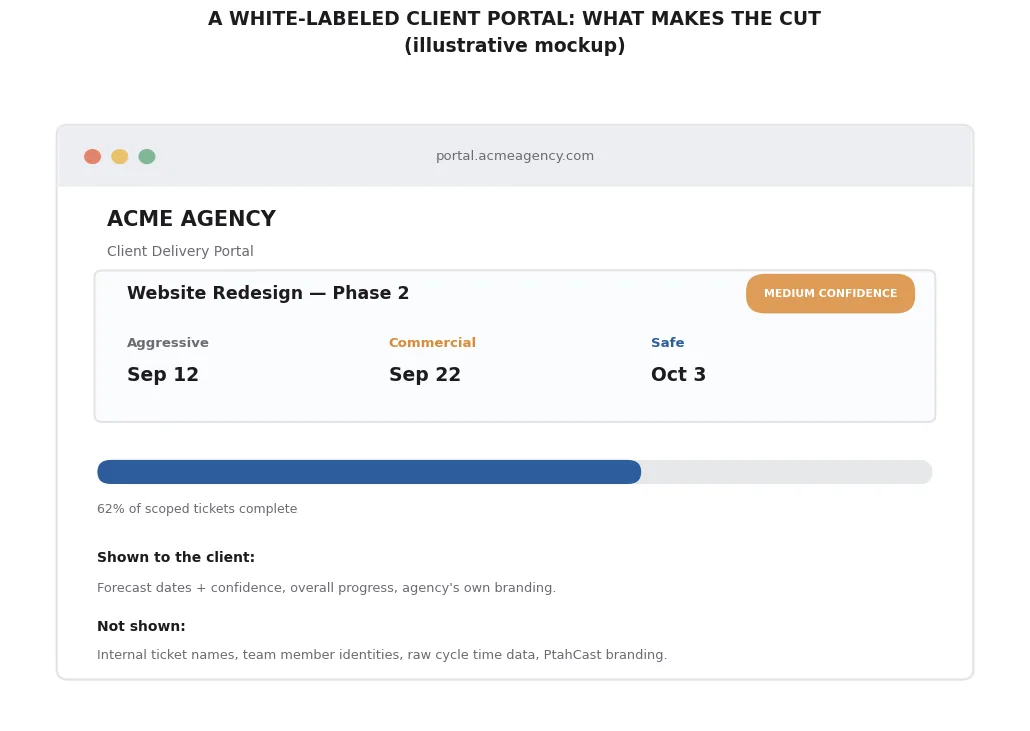
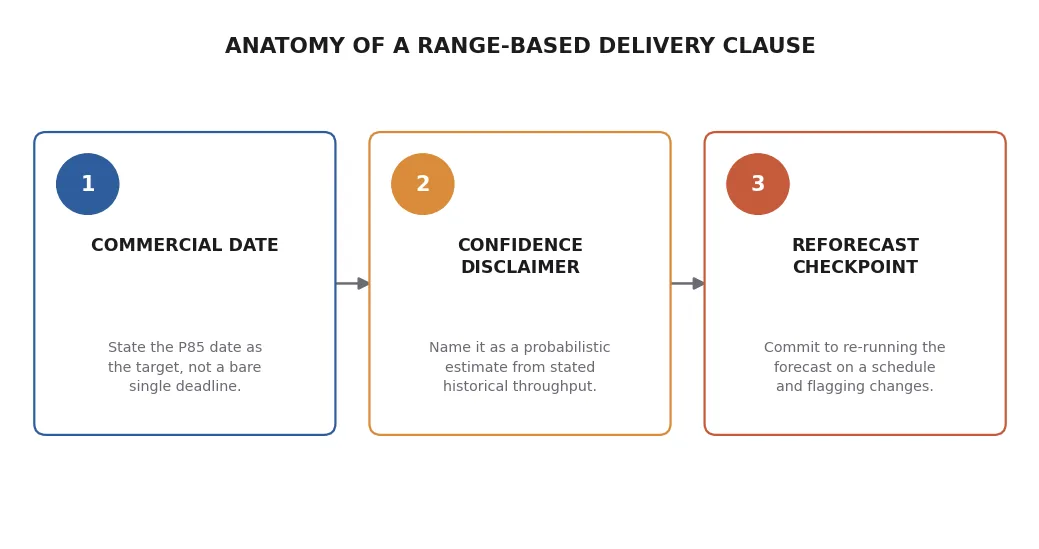
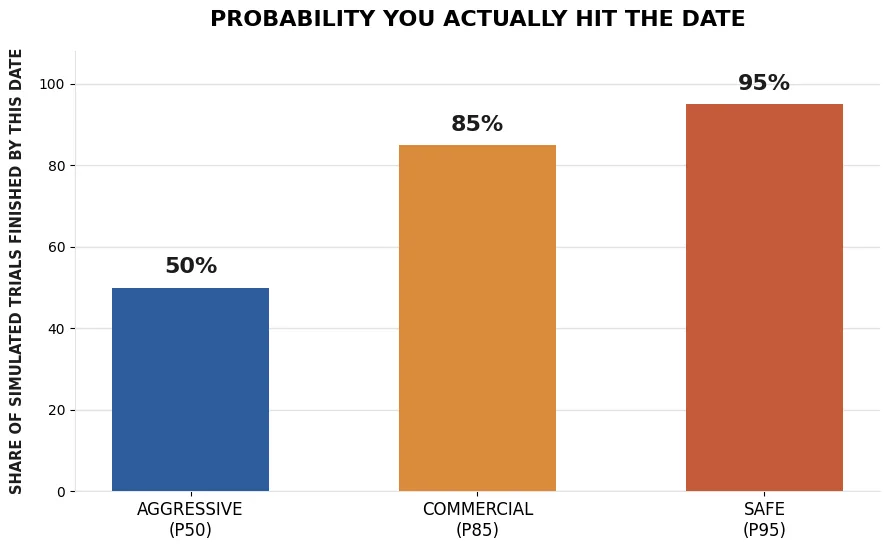
That distribution is what turns into the three numbers PtahCast shows on a forecast: an aggressive date (the P50 — the outcome in the middle, what happens in half of all simulated futures), a commercial date (the P85 — safe enough to put in front of a client, since 85% of simulated futures finished by then or earlier), and a safe date (the P95 — the number you can defend if someone asks what the worst case looks like). None of them are guesses. All three come directly from how the team has actually performed.
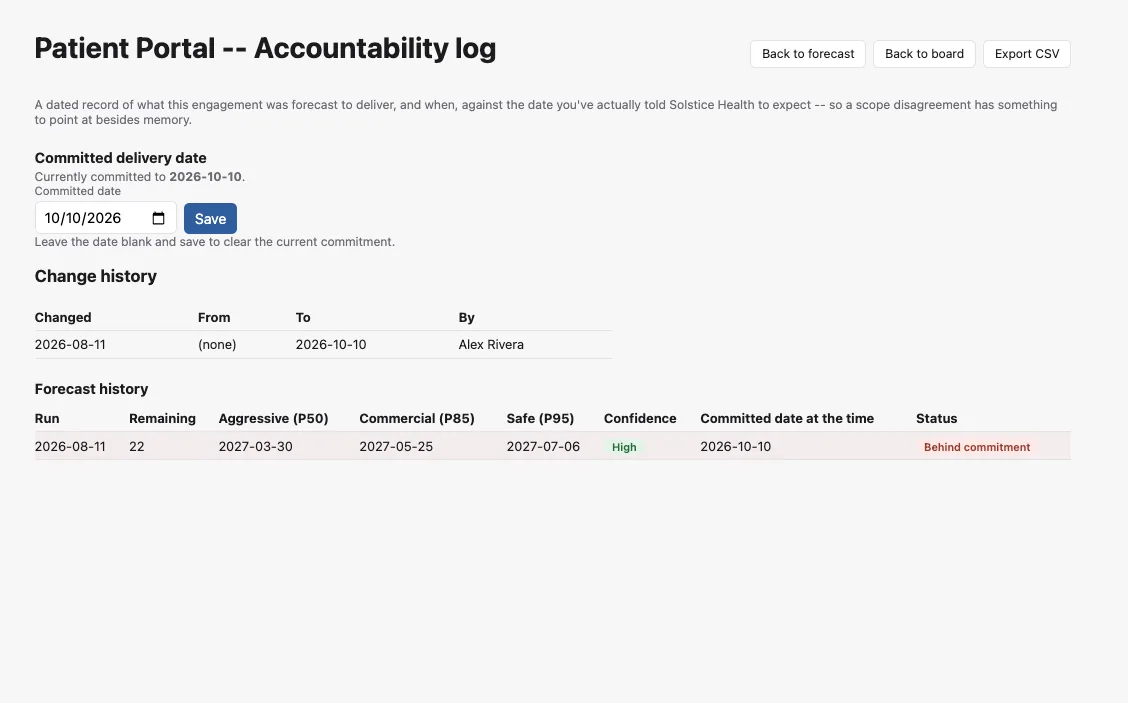
The practical difference shows up the first time a forecast is wrong in the old system versus the new one. With a single date, being wrong is a surprise and an apology. With a probability range, being outside the P85 some of the time is expected — it's the other 15%, and everyone already knew it was possible. That's not a lower bar. It's an honest one, and clients tend to trust honest more than they trust confident.