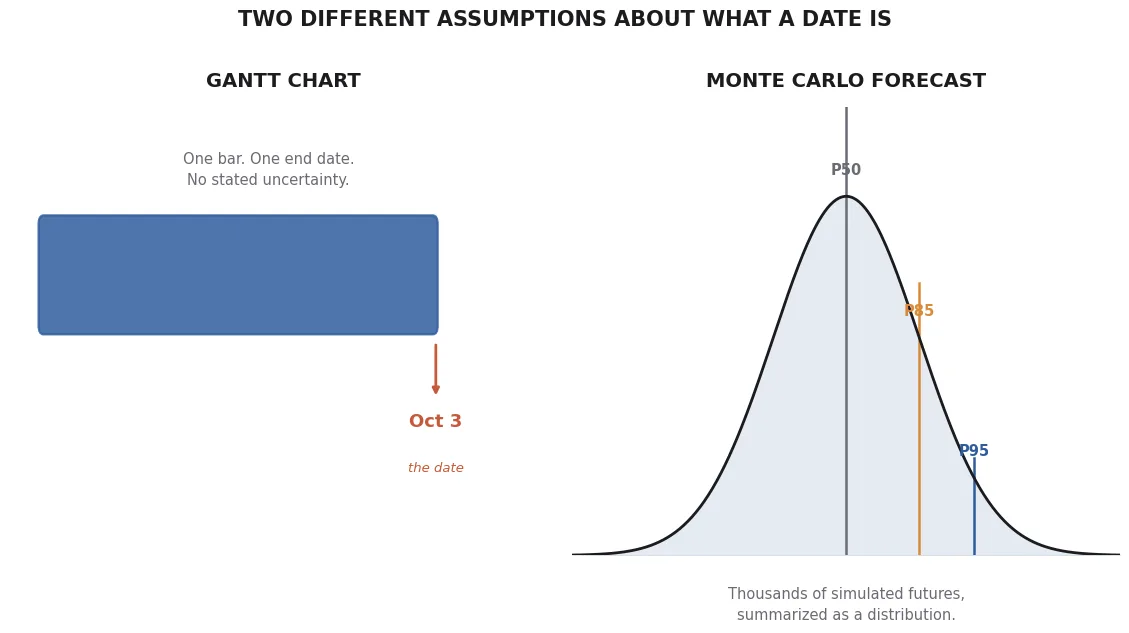
A Gantt chart and a Monte Carlo forecast can describe the exact same project and imply two completely different things about how certain the end date actually is. Both produce a picture with a date on it. Only one of them is honest about what that date represents.
What a Gantt chart assumes
A Gantt bar is a single, deterministic claim: this task starts here, runs for this long, and ends here. Stack enough bars end to end and dependency to dependency, and the chart produces a single project end date — clean, visual, and easy to put in front of a client. The assumption baked into that cleanliness is the problem: every bar's duration is treated as fixed, known, and correct. There's no visual space on a Gantt chart for "this task usually takes four days but sometimes takes nine." It shows four days, full stop, and the chart's confidence in that number is total, regardless of whether anyone actually has grounds to be that confident.
That's not a flaw specific to bad Gantt charts. It's what the format is. A Gantt chart has no native way to represent uncertainty at all — it was built to sequence and visualize dependencies, not to express a probability.
What a Monte Carlo forecast assumes
A Monte Carlo forecast starts from the opposite premise: that any individual duration estimate is uncertain, and the honest response to that uncertainty is to simulate the project thousands of times using the range of durations the team has actually experienced, and see where the simulated outcomes land. The result isn't one date — it's a distribution, summarized as the percentile dates this blog keeps coming back to: P50, P85, P95. The assumption isn't that uncertainty can be eliminated by careful enough planning. It's that uncertainty is real, measurable from historical data, and worth showing rather than hiding.
This is the same distinction the first post on this blog made about single-point estimates in general — a Gantt chart's end date is a single-point estimate with a timeline drawn around it. Rearranging bars doesn't change what kind of claim the final date is.
Where each one actually belongs
This isn't an argument that Gantt charts are useless. They're genuinely good at what they were built for: visualizing sequence and dependency — what has to happen before what, which workstreams run in parallel, where a single resource is double-booked across two efforts. That's real, valuable information a distribution curve doesn't show at all.
What a Gantt chart shouldn't be asked to do is answer "when will this actually be done" as if that were the same question as "what's the planned sequence of work." Those are different questions. Sequencing benefits from a deterministic diagram. A calendar commitment benefits from a model that's honest about the fact that individual durations vary, and that the variance compounds across a multi-task project in ways a straight-line sum of "expected" durations systematically underestimates.
The tell that a Gantt-derived date is quietly overconfident
Chain enough tasks together on a Gantt chart, each with its own "expected" duration, and the total project duration is the sum of those expectations. That sum is very likely to be wrong in the same direction every time — too short — because summing expected values ignores the fact that delays on a critical path compound while early finishes on non-critical tasks don't pull the end date forward. A Monte Carlo forecast captures that compounding automatically, because it's simulating the actual dependency chain thousands of times rather than adding up single best guesses once. That gap between a naive Gantt-chart sum and a simulated distribution's median is often the single biggest source of "why is this project always late," and it has nothing to do with anyone's individual estimate being wrong — it's a structural property of chaining point estimates together at all.