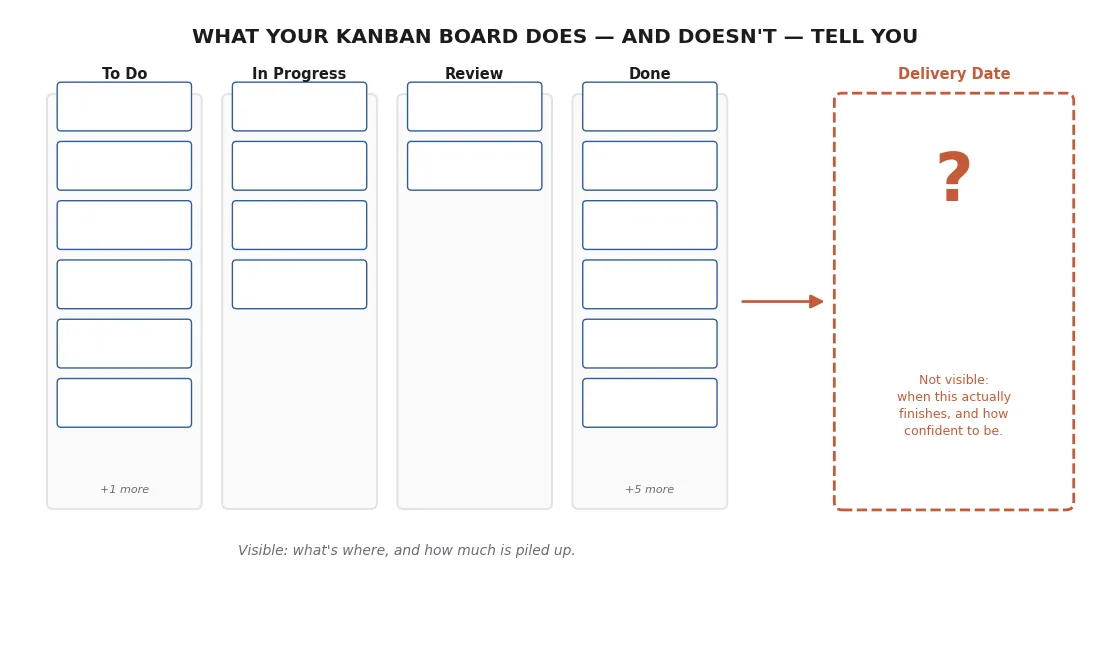
This isn't a pitch to switch tools. Jira, Trello, Linear, Asana — whatever board a team is already running work through, it's very likely doing its actual job well: showing what's in progress, what's blocked, what's piling up in review, what's done. That's real, useful visibility, and none of it needs to be replaced.
What none of those boards do — not because they're built badly, but because it was never what they were built for — is answer the question a client actually asks: when will this be done, and how sure are you?
The board shows state. It doesn't show a forecast.
A kanban board is, at its core, a snapshot: this ticket is here right now, that one is there. Even a board with a clean, well-maintained WIP limit and a tidy column structure is still just describing the present moment. Nothing about the structure of a board — the columns, the cards, the counts — does the work of projecting that present state forward into a probability distribution over future dates. That's a different kind of calculation entirely, and it's simply outside the scope of what a board, by itself, was designed to compute.
Most teams paper over that gap with intuition — a PM looks at the board, eyeballs how much is left, and states a date with more confidence than the board itself actually supports. That's the same single-point-estimate problem the first post on this blog covers in more depth, just arrived at from a different starting point: not a bad estimating habit, but a genuine hole in what the tool in front of the PM is capable of showing.
What's actually missing, specifically
Three things a board alone doesn't give a team, even a well-run one:
A calendar date with a stated confidence level. "14 tickets left in the backlog" is board data. "85% likely to finish by October 3rd" is a forecast. Getting from the first to the second requires knowing the team's actual historical throughput and cycle time — data the board is tracking implicitly, ticket by ticket, but not surfacing as a projection.
An honest range instead of a single number. Even PMs who do the math by hand from board data tend to produce one number, because that's what a client conversation seems to call for. The board has no native concept of "range" at all — it shows cards, not a probability curve.
A record of whether past estimates held up. A board shows the current state, not the history of how well previous state-based guesses turned out. Without something tracking that separately, there's no way to tell whether the team's informal "looks like about three weeks" instinct has actually been reliable or has quietly been wrong in the same direction for months.
Why this gap matters more than it looks like it should
None of this shows up as a crisis day to day — the board still does its job, standups still run off it, work still visibly moves through the columns. The gap shows up specifically at the moment someone has to answer "so when will this be done," which is exactly the moment a client or stakeholder is paying the closest attention. That's a strange place for a well-run process to suddenly be running on intuition instead of data, and it's avoidable: the same completed-ticket history the board already has sitting in it is enough to run a real forecast from, once something is actually doing that calculation.
The fix is adding the missing layer, not switching boards
The board itself doesn't need to change. What's missing is a layer sitting on top of the same kind of ticket history any board already accumulates — one built specifically to turn "here's what's where" into "here's when it'll actually be done, and how confident to be." That's the specific gap PtahCast's board and forecasting engine are built to close: the same tickets, the same columns, the same day-to-day workflow a team already recognizes, with the forecast the board format alone was never going to produce sitting right next to it.