
Stop promising delivery dates. Start forecasting them.
PtahCast runs Monte Carlo simulations against your team's real cycle time and throughput, so every date you give a client is a probability you can defend — not a guess you're hoping holds.
No credit card required.
A real board, mid-project
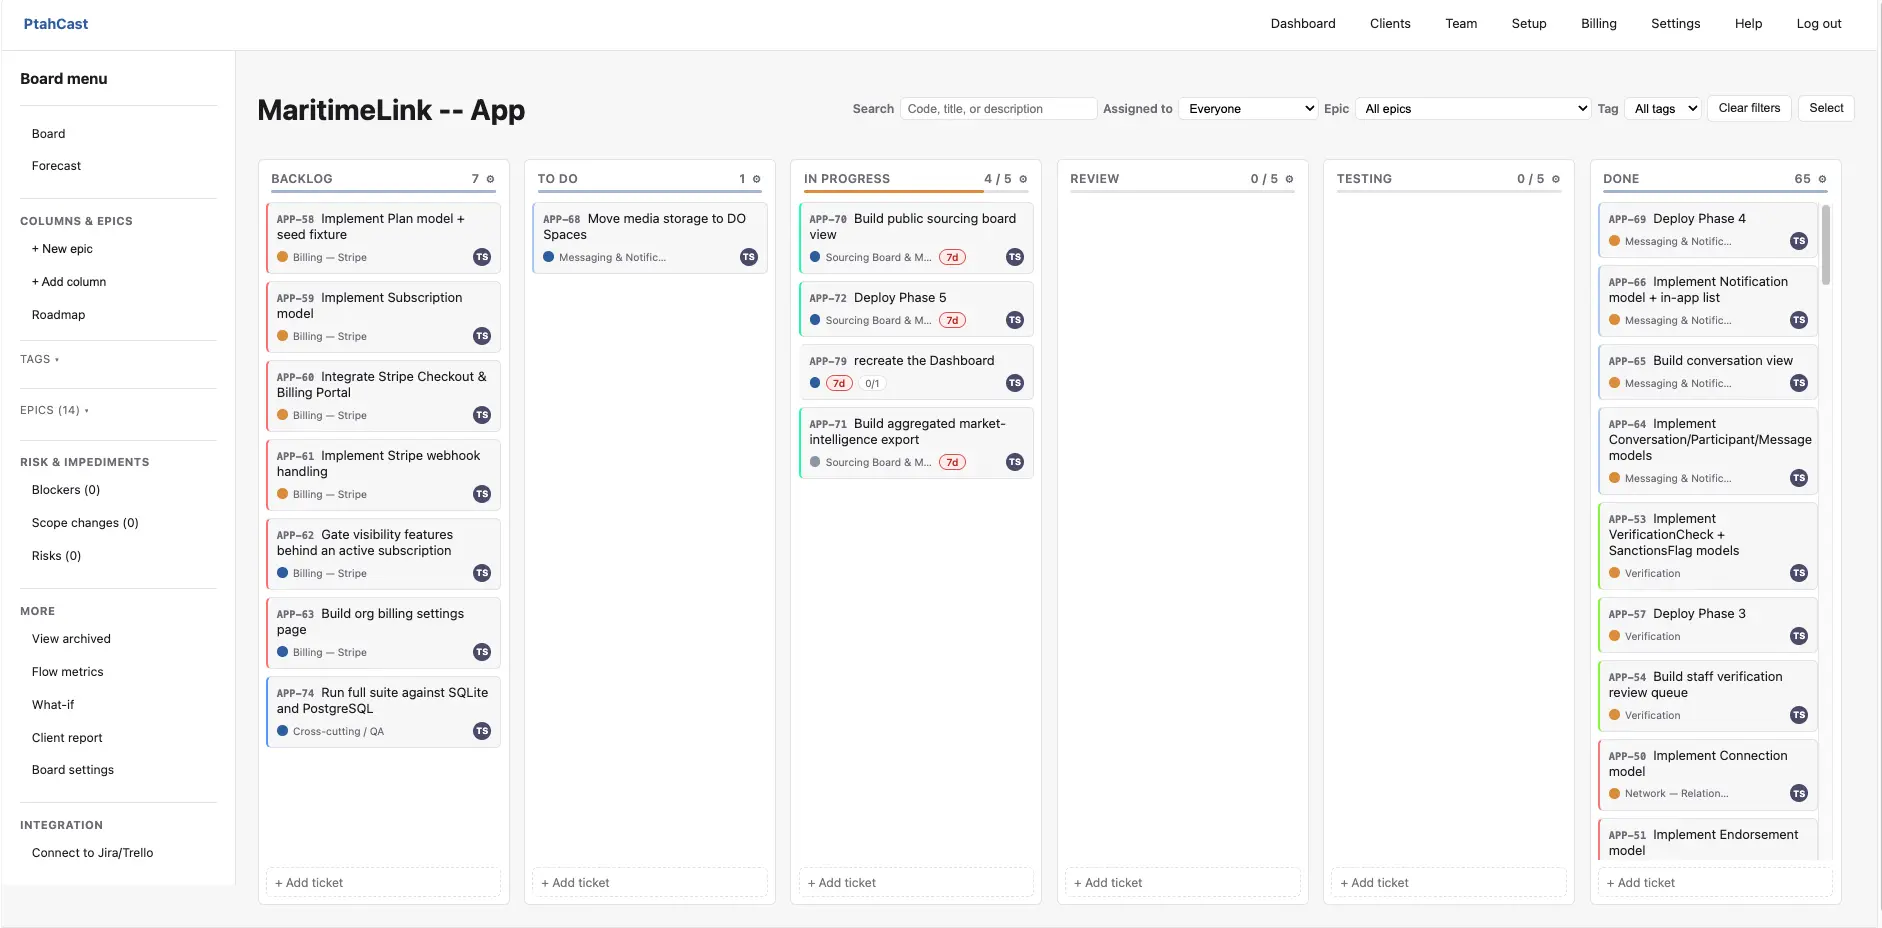
This is an actual PtahCast board mid-sprint — priorities, epics, assignees, and per-column WIP limits. No mockup, no filler data.
The old way breaks the moment reality doesn't cooperate
A single confident date is really just a guess wearing a suit. PtahCast replaces it with a distribution built from how your team actually works.
Old way
One date, no margin for error
A PM eyeballs the backlog and picks a date that sounds reasonable, and it goes straight into the SOW. There's no accounting for scope creep, sick days, or how much slower "In Review" actually runs than planned. When it slips, it's a surprise — to the client, and often to you too.
With PtahCast
A range, weighted by evidence
PtahCast runs thousands of simulated futures against your board's actual cycle times and throughput. You get an Aggressive (P50), Commercial (P85), and Safe (P95) date — plus an accountability log that tracks, honestly, whether you hit them.
Why Monte Carlo, and not just a bar chart
Gantt charts assume every task takes exactly as long as planned. Real work doesn't. Monte Carlo simulation accounts for that variance instead of pretending it away.
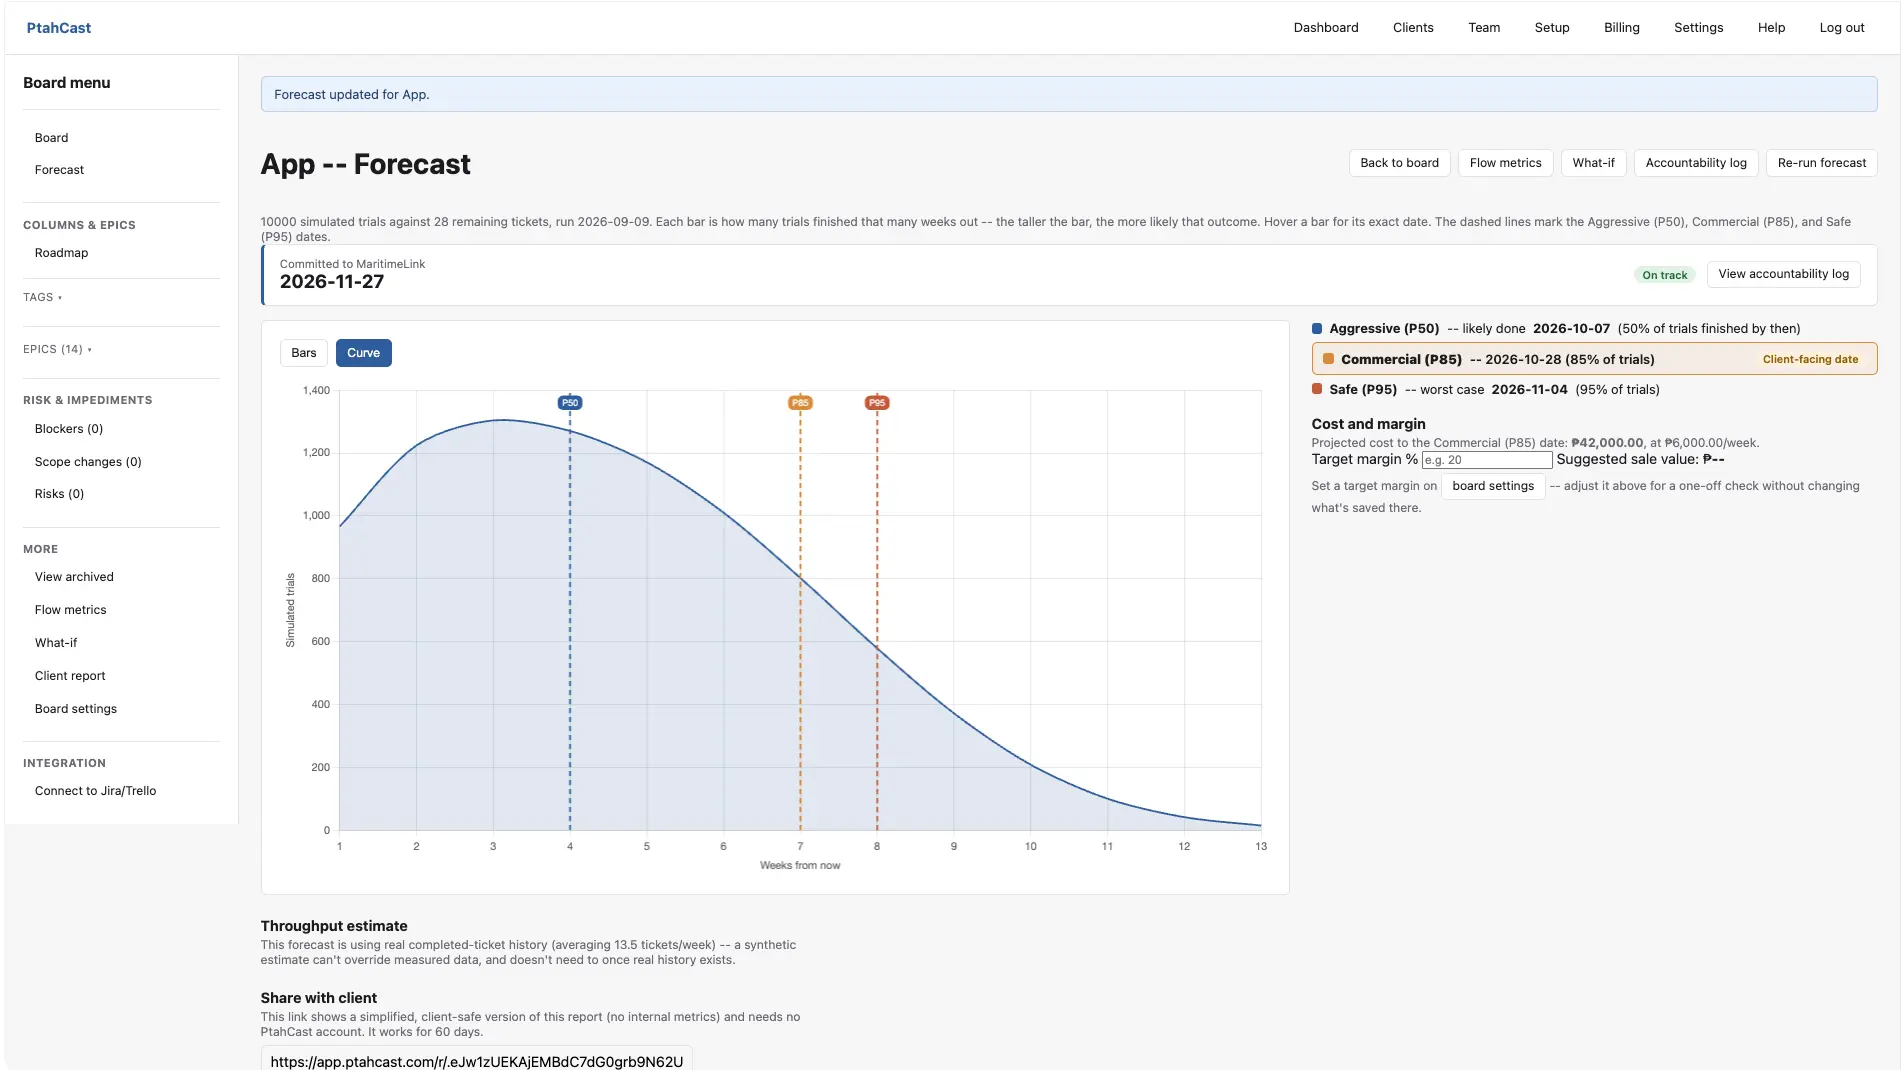
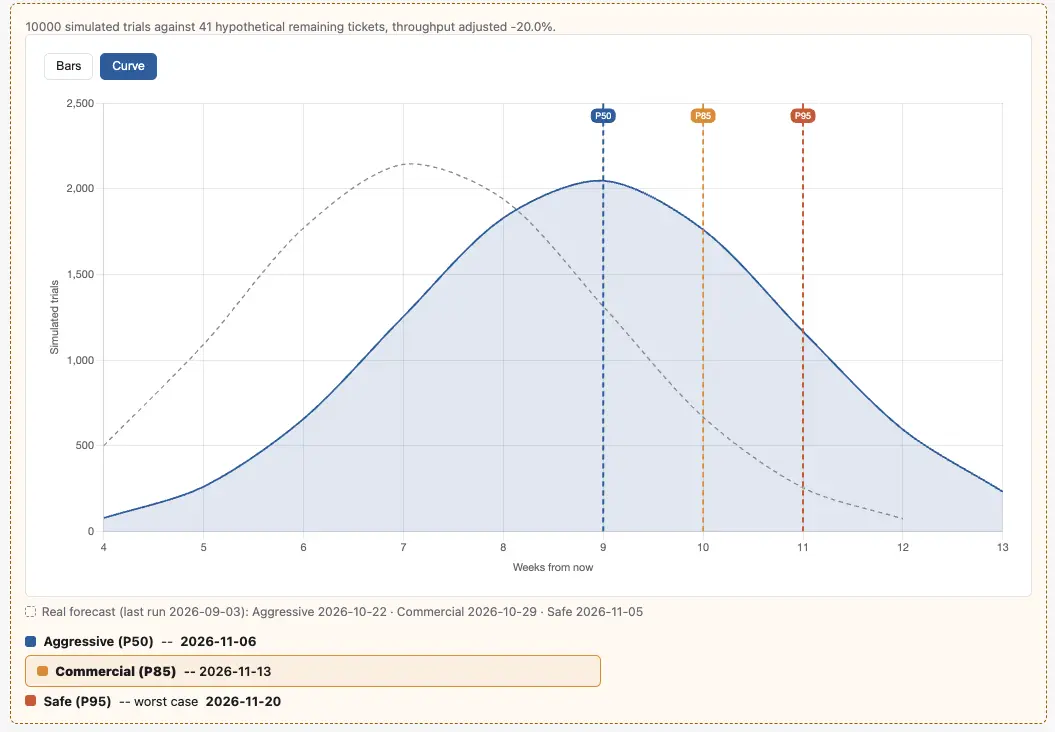
Every simulated trial is one possible future, built by resampling how fast this team has actually completed similar work before. The P50 line is what happens in half of those simulated futures — the outcome you'd bet on. P85 is the date you can put in front of a client and be right most of the time. P95 is the worst case you're prepared to defend if someone asks "what if everything goes wrong?" A bar chart can't tell you any of that. A distribution can.
New to this? Read the complete guide to agile forecasting with Kanban and Monte Carlo simulation →
See PtahCast in action
A short walkthrough of the whole app — the board, the forecast, and everything they feed into.
What it does
One system, from the board your team works on to the report your client reads.
Board
A kanban board built for client work
Priorities, epics, assignees, and WIP limits per column — organized the way delivery teams actually triage work, not a generic to-do list.
Metrics
Flow metrics that explain the forecast
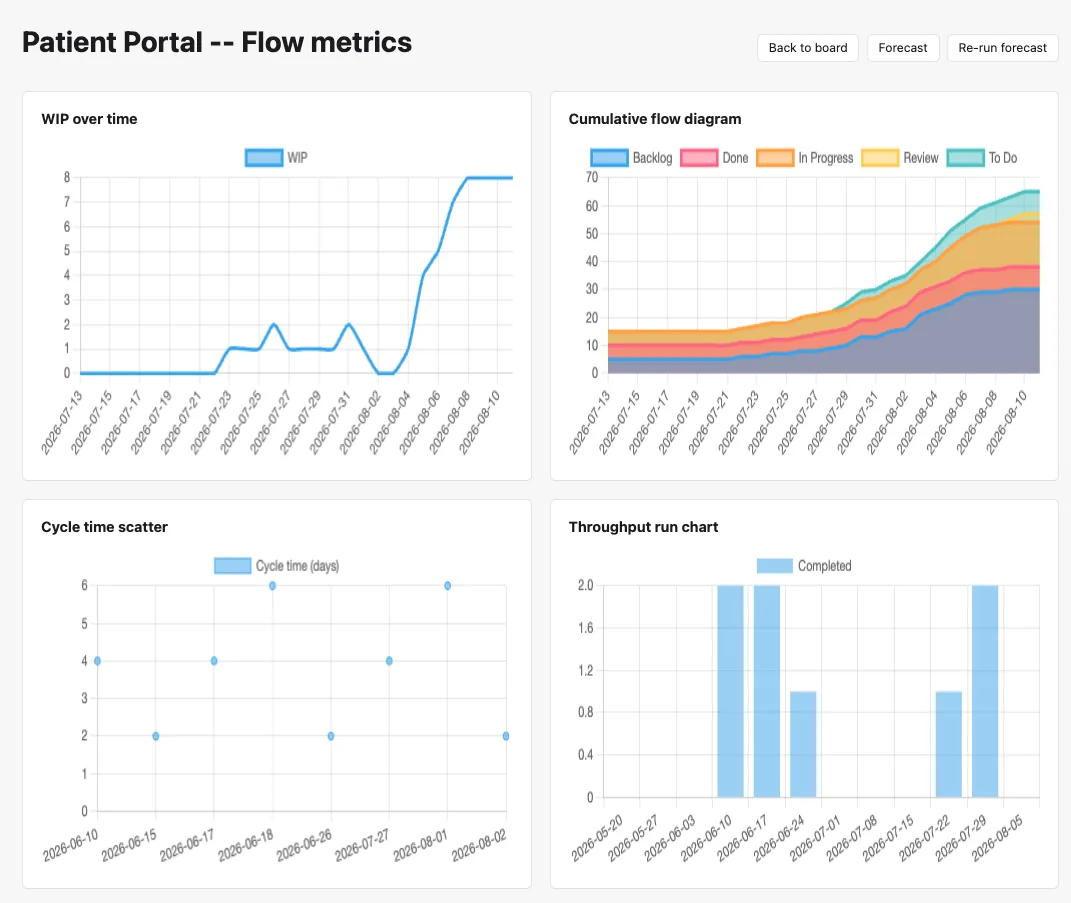
Cumulative flow, cycle time scatter, throughput run charts, and WIP over time — the same data your Monte Carlo forecast is built from, laid out so you can see why a forecast moved.
Forecasting
Monte Carlo delivery forecasts
10,000 simulated trials per run, weighted against your board's real throughput. Get an Aggressive (P50), Commercial (P85), and Safe (P95) date — and re-run it any time the backlog changes.
Accountability
A log of whether you were right
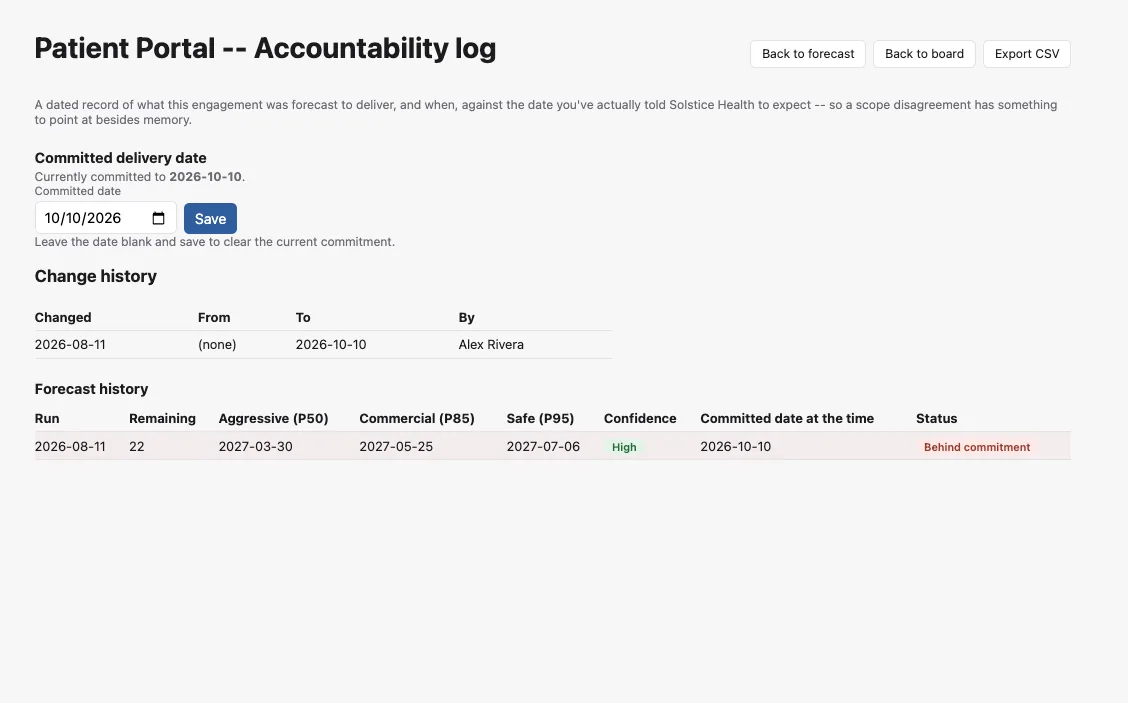
Every forecast you've ever run is saved, alongside the commitment date you gave the client. The accountability log shows, in plain sight, whether you delivered what you promised.
Integrations
Import your backlog from Jira or Trello
Connect a Jira Cloud project or a Trello board, map its statuses onto your PtahCast columns, and pull your existing tickets straight in — no re-typing a backlog by hand just to get a forecast. Configured per board, so each client engagement connects to its own source. One-directional: PtahCast reads from Jira/Trello, it never writes back. Sync runs whenever you click "Sync now."
Board management
Archive or delete a board when an engagement wraps up
Archive a finished board straight from the client page — it comes off your active list and the client portal, but every ticket, comment, forecast, and throughput record stays intact, and unarchiving puts it right back. Owners and Admins can permanently delete a board instead, for one that genuinely doesn't need to be kept.
Blockers
Know how many days were the client's
Every blocker is tagged Client, Agency, Third-party, or Other the moment it's logged. See the breakdown on the board, and hand the client-caused total straight to the client — framed neutrally, not as blame.
Scenarios
Ask "what if" without touching the real forecast
Override the remaining scope or apply a throughput multiplier — what if the client adds 20 tickets, what if you add a developer — and PtahCast runs the same Monte Carlo engine against it. Your last real forecast renders behind the result as a dashed gray "ghost" curve, so the hypothetical reads against your actual numbers instead of floating alone. Nothing is saved; refresh the page and the scenario is gone.
Risk
Log what might go wrong before it does
Score a risk Low/Medium/High on probability and impact, add a mitigation note, and leave it agency-private by default — a risk is a prediction, not yet a fact. If it comes true, one click "materializes" it straight into a Blocker, pre-filled and linked back, so your risk log and your blocker log never drift apart. Share a risk with a client only if an Owner or Admin explicitly turns it on.
Support
A support inbox for clients, right where their forecast already lives
Turn it on per client, and their portal gets a "Support" tab alongside their delivery forecast — same magic-link login, no new account. A client can file a ticket, reply on it, and see it through to resolved; your team replies back or leaves an internal note that never reaches them. The ticket list shows a live Monte Carlo forecast for the whole support queue, and every ticket gets its own plain-language ETA based on where it sits in line.
Roadmap
See every epic's real finish date, in queue order
Every epic with work left gets an automatic band on one timeline, ordered by value against what's left to do — each band starting only once the epic ahead of it is expected to land. Switch between Aggressive (P50), Commercial (P85), and Safe (P95) and every date recomputes from scratch, not just the top one. Drag epics into whatever order the team will actually work them, and the whole timeline follows.
Finance
Turn a forecast into a number the client never sees
Set a currency, weekly burn rate, and agreed sale value on any board, and its Commercial (P85) forecast becomes a projected cost and a margin or loss — recalculated fresh every time you load the page, never frozen at whatever the rate was when the forecast ran. A built-in calculator suggests a sale price from your target margin. Run the same numbers through a What-If scenario — model losing or adding someone from the rate itself — and see the hypothetical margin against your real one, side by side. None of it reaches the client-facing report.
Aging
See what's aging before it's late
A chart on your flow metrics dashboard bars every ticket currently in progress by how many days it's been open, oldest first, against a dashed line marking your board's own historical 85th-percentile cycle time. Every other chart here only ever tells you about finished work — this is the one that flags a ticket already running long while there's still time to do something about it.
SLA
A badge for "this ticket is taking too long"
Set a day threshold on any board — Owner or Admin only — and any ticket still in progress past it shows a warning badge right on its card, no dashboard visit required. Leave it unset and nothing on the board changes. Board settings suggests a starting number from the board's own historical P85 cycle time, but the threshold you actually set is entirely yours to pick.
The engine underneath: every forecast PtahCast produces comes from a Monte Carlo simulation seeded with your board's own completed-ticket history — not an industry benchmark, not a formula someone typed into a spreadsheet once. Change your team or your backlog, and the next forecast changes with it.
Alone in its category
Other Monte Carlo forecasting tools stop at the delivery date — none of them turn it into a cost or margin figure. PtahCast does, and the projected cost survives a rate change mid-project instead of quietly recalculating the past at today's rate.
Read how it works →Pricing
Every plan includes the full Monte Carlo forecasting engine — the difference is how many clients you're running it for.
Starter
Founders price — 50% off
$29$14.50/mo
Up to 3 clients
The complete PtahCast feature set — Monte Carlo engine, white-labeled portals, PDF exports, and more. Same on every plan.
Start free 30-day trialGrowth
Founders price — 50% off
$79$39.50/mo
Up to 10 clients
The complete PtahCast feature set — same as every plan, just more client capacity.
Start free 30-day trialMost popular
Agency
Founders price — 50% off
$149$74.50/mo
Up to 25 clients
The complete PtahCast feature set — same as every plan, sized for a full roster.
Start free 30-day trialScale
Custom
25+ clients
The complete PtahCast feature set, plus dedicated support, an SLA, and tailored onboarding.
Contact salesFounders price applies to Starter, Growth, and Agency for the first 50 agencies who sign up, locked in for as long as the subscription stays active. Prices shown are per month. Contact us for annual billing or custom Scale terms. No credit card required to start your 30-day trial.
Prefer to run it yourself?
PtahCast runs in a Docker container, so it can run entirely on your own network — your infrastructure, your data never leaves it. A one-time license, not a subscription. Get in touch and we'll walk you through it.
Your agency's name on every forecast — not ours
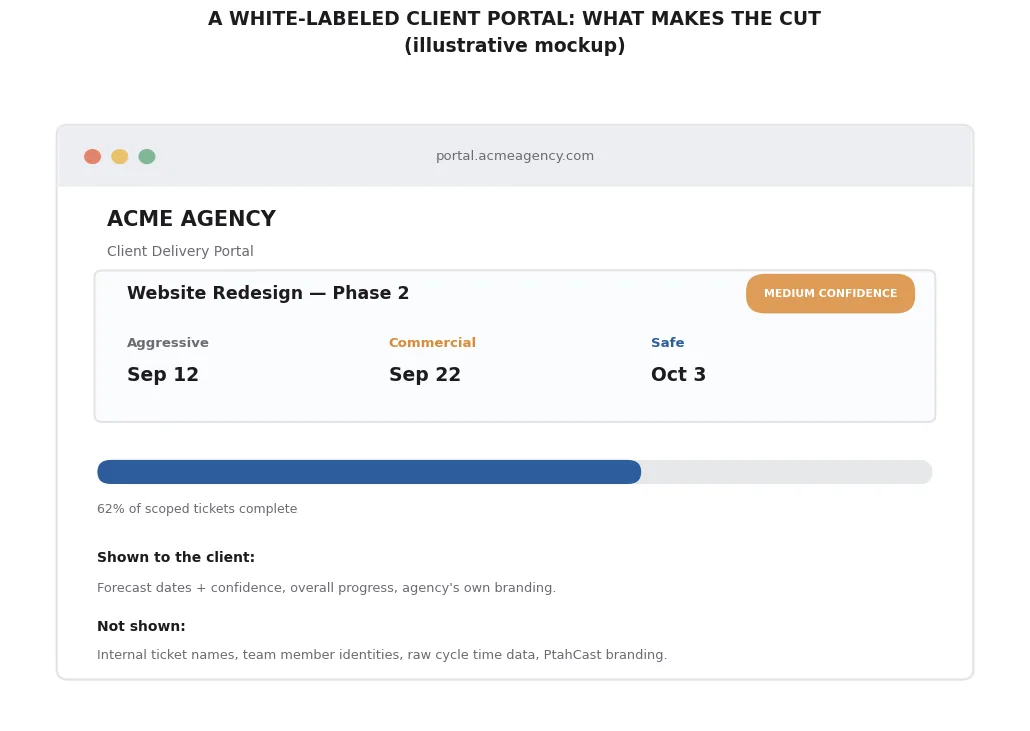
Every plan's client portal carries your logo and your color, not PtahCast's, on your own custom domain. Clients get a report; they never need to know what's running underneath it.
FAQ
What is Monte Carlo forecasting, exactly?
It's a simulation technique that runs a scenario — in this case, "finish the remaining backlog" — thousands of times, each time resampling from your team's actual historical cycle times and throughput. Instead of one predicted date, you get a full distribution of possible completion dates and how likely each one is.
Do I need a lot of historical data before PtahCast is useful?
No — it works from your first completed tickets. Forecasts get tighter and more confident as your board accumulates history, but you'll get a usable range from day one.
Do I need a credit card to start the free trial?
No. The 30-day trial starts with just an email — no credit card required. You'll only be asked for payment details if you decide to continue on a paid plan afterward.
Can my clients see PtahCast branding?
No. Every plan's client portal is fully white-labeled with your logo, your color, and your own custom domain — there's no PtahCast branding on any tier.
How is this different from a Gantt chart or a single due date?
A Gantt chart bakes in one assumption per task and hides the uncertainty. Monte Carlo forecasting keeps the uncertainty visible — you see the full range of outcomes and how likely each one is, instead of a single date with no sense of how solid it is.
What happens if I miss a forecasted date?
It shows up in your accountability log. That's the point — PtahCast is built to keep a running, honest record of your forecasts versus what actually happened, not to hide the misses.
Can I re-run a forecast?
Yes, any time your backlog or team changes. A new simulation takes seconds and updates your Aggressive, Commercial, and Safe dates immediately.
Can I import my existing Jira or Trello backlog?
Yes. Connect a Jira Cloud project or a Trello board per board in PtahCast, map its statuses onto your PtahCast columns, and import your tickets directly. It's one-directional — PtahCast reads from Jira/Trello, it never writes back — and sync runs manually whenever you click "Sync now," so nothing changes on your board without you asking it to.
Give your next client a real answer
Start free, connect a board, and see your first Monte Carlo forecast in minutes.
No credit card required.