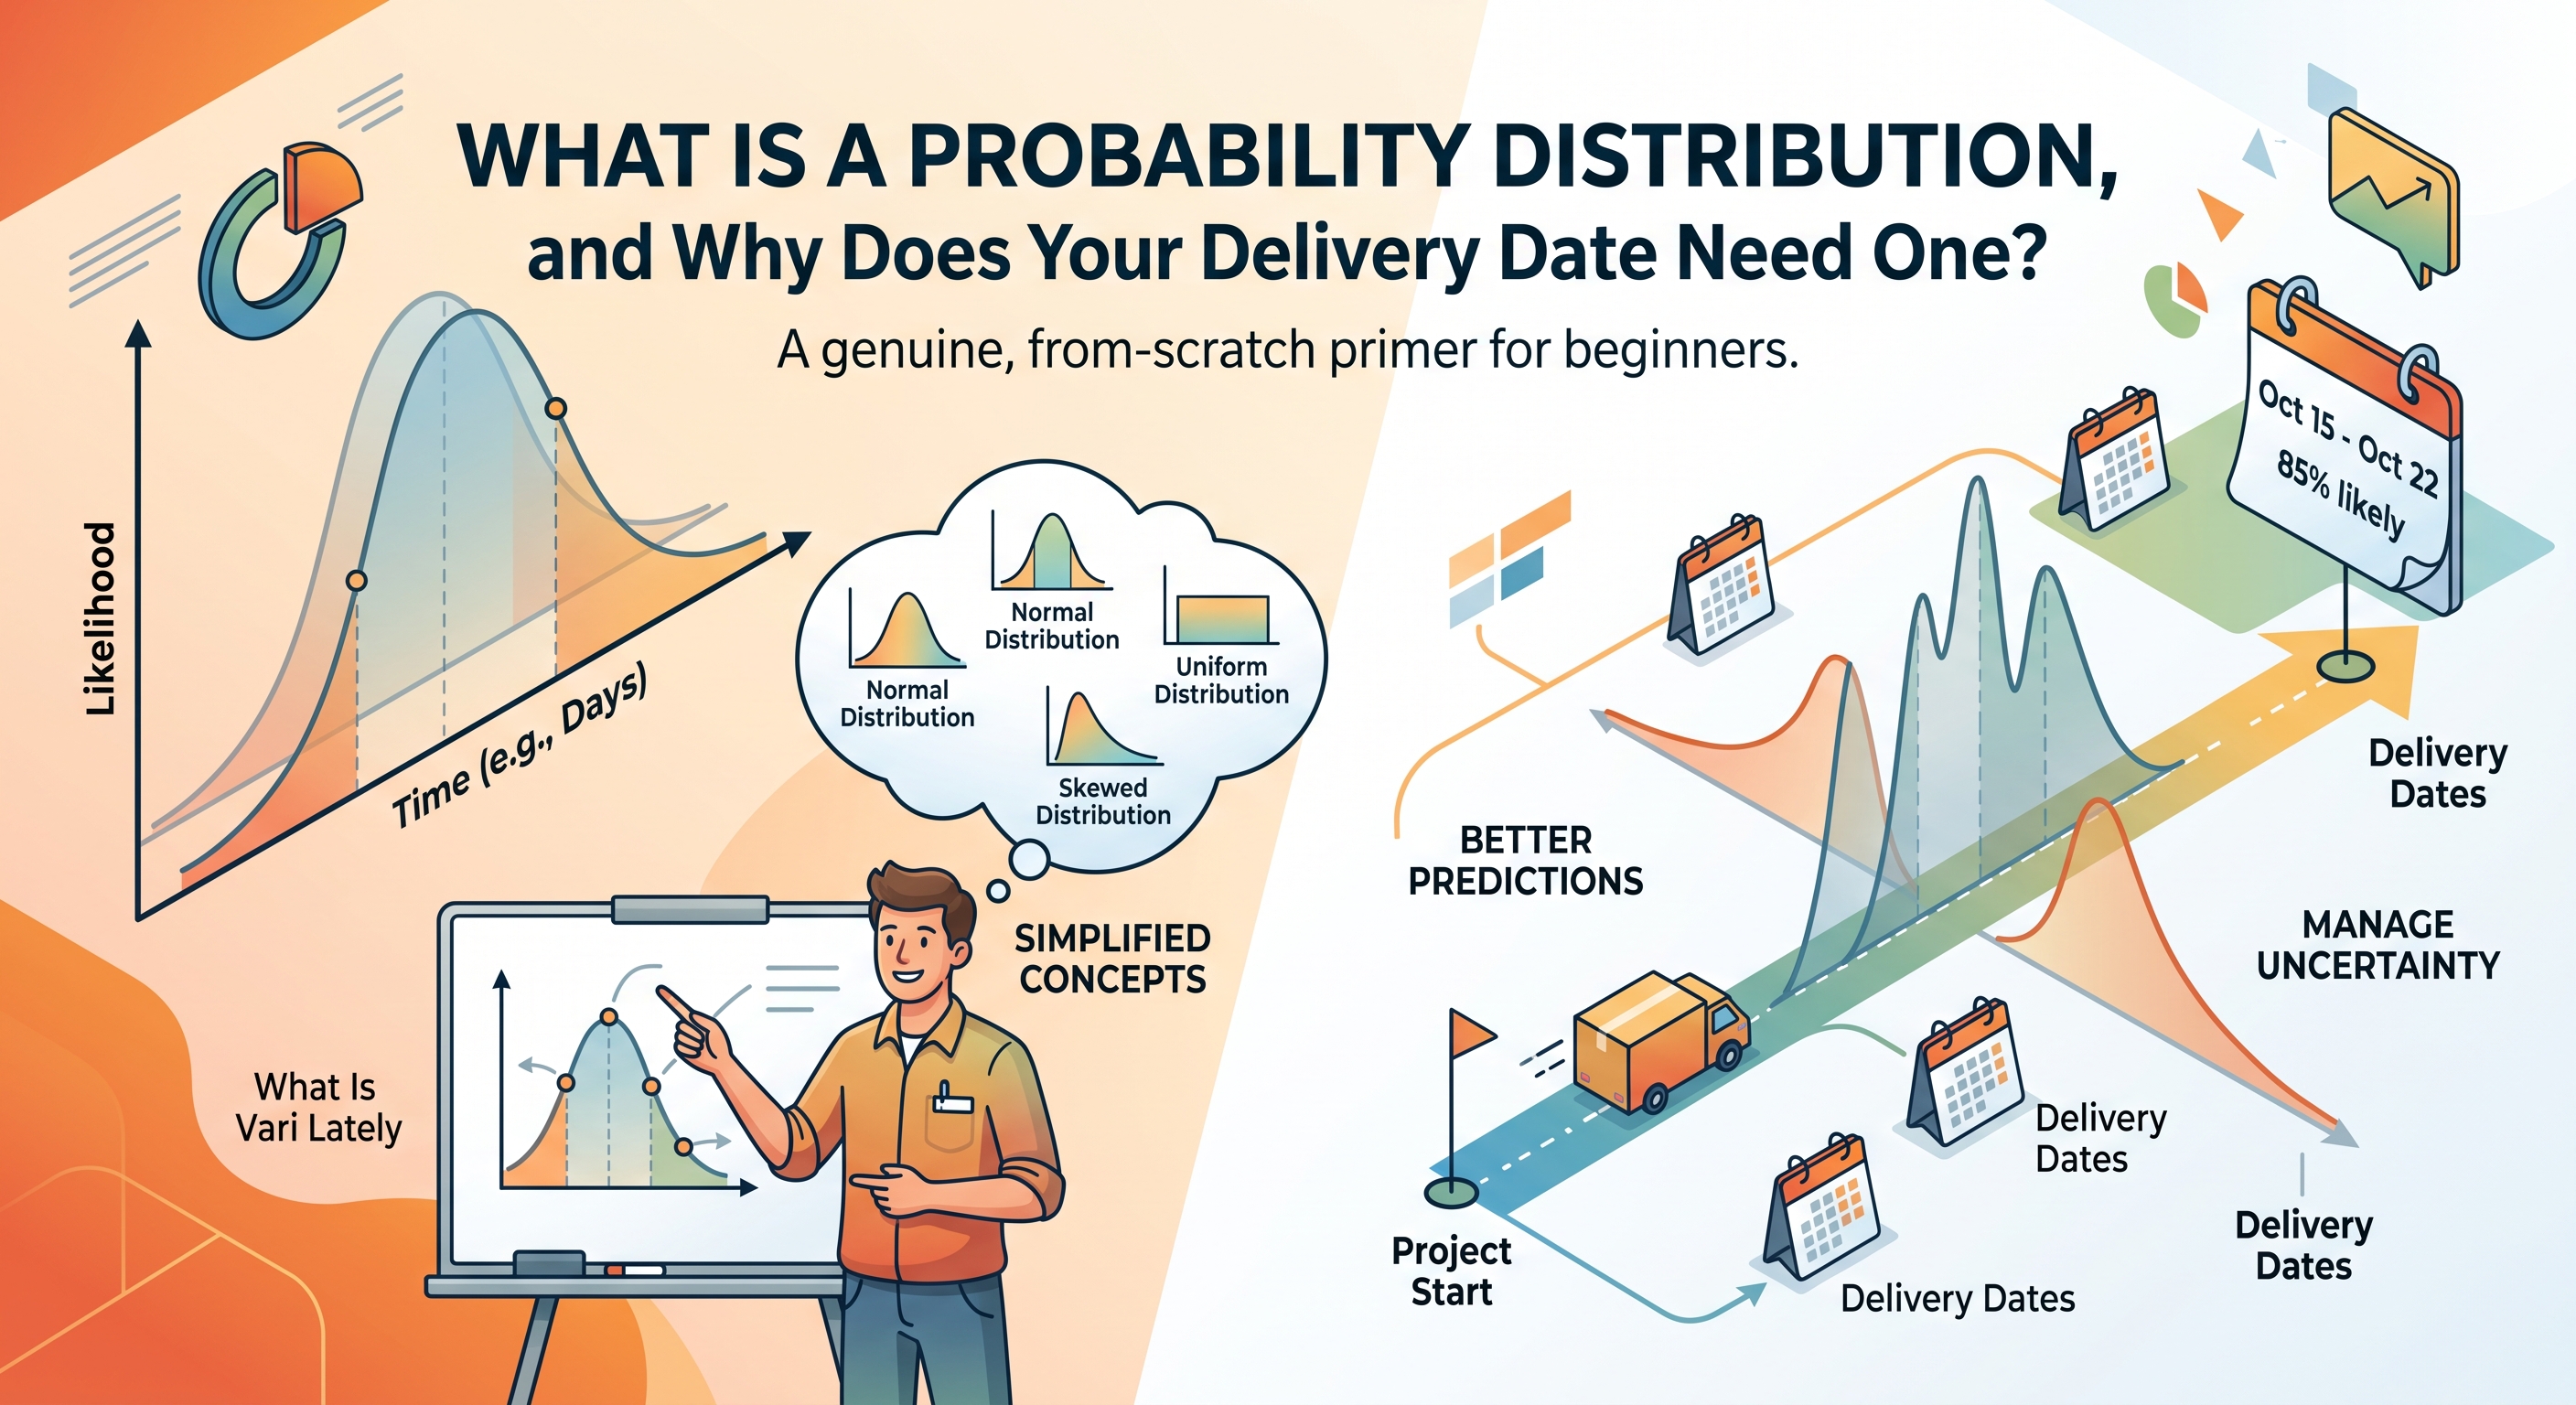
Every other post on this blog assumes some familiarity with Monte Carlo forecasting, percentiles, and confidence levels. This one doesn't. If the phrase "probability distribution" sounds like something from a statistics class you'd rather forget, this is the explanation that starts from nothing and builds up to why it matters for something as ordinary as a delivery date.
Start with something familiar: a weather forecast
"There's a 70% chance of rain tomorrow" is a sentence almost everyone understands intuitively, and it's already doing something more sophisticated than it gets credit for. It isn't saying "it will rain." It isn't saying "it won't rain." It's saying: out of all the ways tomorrow could plausibly unfold given today's conditions, rain happens in 70% of them and it stays dry in the other 30%. Two outcomes, each with a number attached describing how likely it is.
That's a probability distribution. Not a complicated one — just two possibilities and two percentages — but structurally, it's the exact same idea behind every more elaborate version of the concept. A probability distribution is simply a full list of the things that could happen, alongside how likely each one is.
Most real situations have more than two outcomes
Weather is usually described with just a couple of buckets because that's what's useful to communicate, but the actual physical reality behind it — tomorrow's rainfall, in millimeters — could land anywhere across a continuous range: 0mm, 2mm, 15mm, anything. A distribution over that range wouldn't just have two bars, it would have a shape: a lot of likelihood piled up around the most probable outcomes, tapering off toward the ones that are possible but unlikely.
The illustration above shows a few of the common shapes this can take. A normal distribution is the familiar symmetric bell — most outcomes cluster near the middle, with rarer ones tapering off evenly on both sides. A skewed distribution leans one way, with a longer tail stretching out in one direction — common when something can run arbitrarily late but can't finish arbitrarily early. A uniform distribution is flat — every outcome in a range is equally likely, with no clustering at all. The shape isn't decoration. It's the actual content of the answer to "what might happen."
What this has to do with a delivery date
A delivery date is uncertain in exactly the same structural way tomorrow's rainfall is. There isn't one true answer sitting out there waiting to be guessed correctly — there's a real range of plausible finish dates, some more likely than others, depending on how the remaining work actually goes. A single date like "we'll be done on the 15th" is the delivery-date equivalent of a weather forecaster picking one specific temperature and refusing to say anything about how confident they are in it. It might turn out to be right. It's also throwing away the most useful part of the answer: how much to trust it, and what the realistic range around it actually looks like.
Monte Carlo forecasting exists specifically to stop throwing that information away. Instead of picking one date, it builds the actual distribution — by simulating "finish the remaining backlog" thousands of times, each run resampling from a team's real historical cycle time and throughput, the same way a weather model runs many simulations of the atmosphere and reports how often each outcome occurred. The result is a genuine distribution over finish dates, with a likelihood attached to every point in it, not a single guess wearing a suit.
Why the shape matters more than the average
It's tempting to skip straight to "just give me the average date," but an average throws away exactly the part of a distribution that matters most for planning: how often things run long, and by how much. Two projects can have the same average finish date and completely different risk profiles — one with a tight, symmetric spread where the worst case is barely worse than the average, another with a long tail where things occasionally run dramatically late. An average can't tell those two situations apart. Only the shape of the full distribution can.
This is why a real forecast reports more than one number. The P50, P85, and P95 dates this blog refers to constantly are just three specific points read off that underlying shape — the middle, a safer point further along the tail, and a still-safer point beyond that. They're not three separate guesses. They're three readings of the same distribution, chosen because they answer three different practical questions: what's likely, what's safe to commit to, and what's the realistic worst case.
You don't need to do the math yourself
None of this requires actually calculating anything by hand. The useful takeaway is just the shift in how to think about an uncertain date: not "what's my best guess," but "what's the real range of outcomes, and how likely is each part of it." Once a forecast is built that way, how much to trust it becomes its own separate, answerable question — one that gets better as more real data replaces assumption, the same way a five-day weather forecast is less certain than tomorrow's.
A single delivery date was always an attempt to compress a genuine range of outcomes into one number, the same way "it will rain tomorrow" compresses an actual 70% chance into a false certainty. The fix isn't a better guess. It's not guessing at all — showing the range that was always there, honestly, instead of hiding it behind one confident-sounding date.
Understanding the shape is the easy half. Putting that shape in front of a client without losing them in the process is its own skill, and worth walking through separately.