Most teams watch velocity. They watch the backlog. They watch the deadline. Almost nobody watches, on purpose, the one number that actually predicts whether that deadline holds: how many tickets are in progress at the same time.
That number is WIP — work in progress. It's easy to ignore because it doesn't feel like a metric, it feels like a side effect of everyone being busy. It isn't a side effect. It's closer to a lever, and it's usually the most direct one a team has.
The math nobody applies to their own board
There's a relationship called Little's Law that shows up anywhere work queues through a system — a supermarket checkout, a highway on-ramp, a support inbox, a kanban board. Stated plainly: cycle time equals WIP divided by throughput. How long a ticket takes to finish is a direct function of how many tickets are competing for attention at once, divided by how many the team can actually finish per period.
Nothing about that equation is a theory or a best practice. It's closer to arithmetic. If a team's throughput stays roughly constant — and over any reasonably short window, it does — then doubling WIP roughly doubles how long each ticket sits in progress. Add more open tickets without adding more finishing capacity, and every one of them, including the one that was supposed to be quick, takes longer.
Why more in progress doesn't mean more getting done
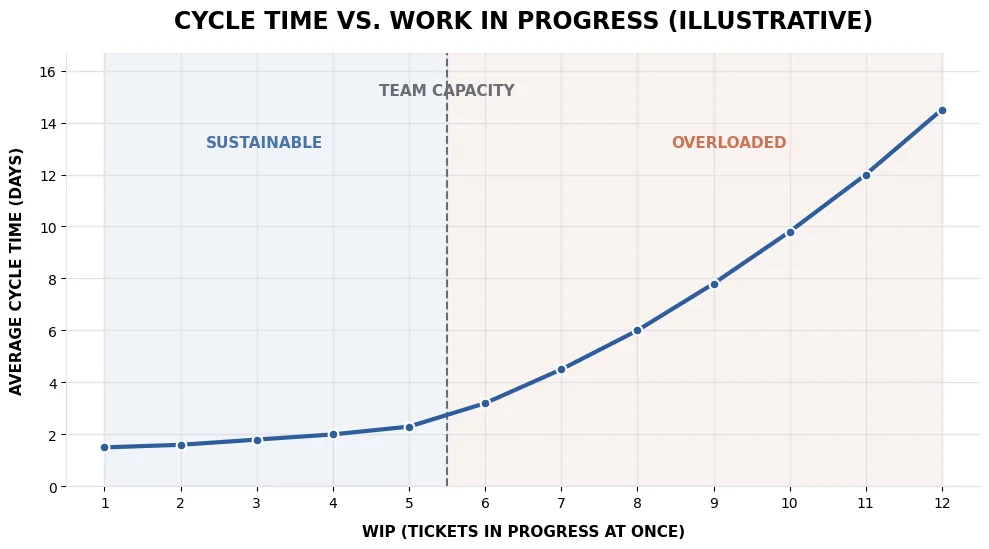
The intuitive assumption is that starting more work gets more work done. It doesn't, past a point, because attention doesn't split for free. Every extra ticket someone is nominally responsible for is a context switch waiting to happen — a Slack message, a code review, a "quick question" that pulls focus off whatever was actually being worked on. Throughput doesn't scale with WIP the way it feels like it should. It rises for a while, then flattens, then in a genuinely overloaded team, it can drop — more open tickets, fewer of them actually finishing per week, because everyone is thrashing between half-finished things instead of closing any of them.
That's the shape in the chart above. It's an illustrative curve, not measured data from any specific team, but the shape itself isn't hypothetical — it's what Little's Law predicts and what shows up on real boards constantly. Cycle time stays low and roughly flat while WIP sits within what a team can actually sustain. Push WIP past that point, and cycle time doesn't creep up gently. It bends upward fast, because the same overload that's slowing throughput is also stacking more unfinished work on top of it at the same time.
What this has to do with your forecast
PtahCast's Monte Carlo forecast is built directly from a team's historical cycle time and throughput — the same two numbers this whole relationship runs on. A board that lets WIP run unbounded doesn't just feel chaotic day to day; it makes cycle time itself unstable, which makes the historical distribution the forecast resamples from wider and less predictable, which makes every forecast built on top of it less confident than it needs to be. Keeping WIP in check isn't just a delivery-speed lever. It's what keeps a team's own history worth forecasting from in the first place.
That's the real reason every column on a PtahCast board can carry its own WIP limit. It's not a process box to tick. It's the one control most directly connected to whether the next date you tell a client is one you can actually hit.
The actual takeaway
If a delivery date is at risk, the instinct is usually to push harder, start more, parallelize more. Often the faster fix is the opposite: finish more before starting more. Lower WIP, not higher effort, is usually the most direct way to bring cycle time back down — and to keep the number a forecast is even possible to trust.
For how cycle time and WIP show up together on an actual board, see Reading Your Flow Metrics.